
Poverty
Global Definition
According to the World Bank, poverty is defined as a state of “pronounced deprivation in well-being.”
This holistic definition goes beyond mere income deprivation. It includes:
- Lack of access to basic resources (like clean water, healthcare, education).
- Inability to meet essential needs for survival and development.
- Failure to enjoy a minimum acceptable standard of living, including dignity and societal participation.
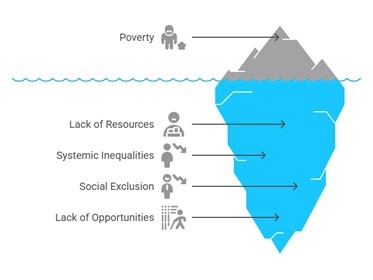
In essence, the World Bank sees poverty as multi-dimensional, linking economic deprivation with social exclusion, lack of opportunity, and vulnerability.
Indian Approach to Poverty
In India, the commonly followed approach to poverty has traditionally been narrower and survival-centric.
- The official definition tends to focus on a “minimum level of living,” which includes only the most basic human needs—such as food, shelter, and clothing.
- This subsistence approach does not fully account for other vital aspects like:
- Access to quality healthcare and education.
- Social security and employment opportunities.
- Living with dignity and freedom from exploitation.
This has sparked debate, with critics suggesting that India’s poverty estimation often underestimates the true scale of deprivation.
Measurement of Poverty in India
Earlier Framework – Planning Commission Era
- The Planning Commission was historically responsible for estimating poverty.
- These estimates were derived from data collected by the National Sample Survey Office (NSSO), based on Monthly Per Capita Consumption Expenditure (MPCE).
- Poverty lines were calculated by identifying the expenditure required to meet minimum calorie norms (2,400 kcal for rural and 2,100 kcal for urban).
- This method was criticized for being outdated and ignoring other dimensions of poverty.
Current Framework – Role of NITI Aayog
- After the dissolution of the Planning Commission, the responsibility of poverty measurement was transferred to NITI Aayog.
- NITI Aayog now uses data from the NSSO, which operates under the Ministry of Statistics and Programme Implementation (MOSPI).
- Estimates are made separately for rural and urban areas, taking into account updated consumption patterns and cost of living.
However, India still lacks an official poverty line post-Planning Commission, and the issue of setting a multidimensional poverty metric is still under discussion.
International Cooperation Against Poverty:
IBSA Trust Fund
- IBSA refers to a trilateral development initiative between India, Brazil, and South Africa.
- The IBSA Trust Fund was established to support development projects and combat poverty in other developing countries, especially in Africa, Latin America, and Asia.
- The agreement was signed during the 8th IBSA Trilateral Ministerial Commission Meeting in Durban (2017).
Key features:
- Each country pledges an annual contribution of $1 million.
- Fund is managed by the Special Unit for South-South Cooperation under the United Nations Development Programme (UNDP).
- Projects focus on capacity building, infrastructure, education, healthcare, and rural development.
IBSA Dialogue Forum
- The IBSA Dialogue Forum was created to promote South-South Cooperation—an idea emphasizing mutual support among developing nations.
- The forum was officially launched through the Brasilia Declaration in 2003.
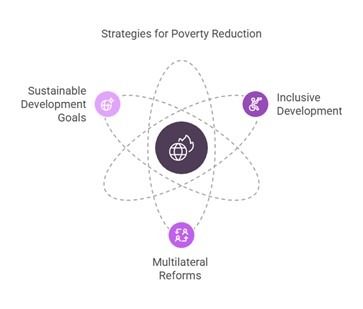
- It serves as a platform for consultation and coordination on global issues, such as:
- Inclusive development.
- Multilateral reforms.
- Sustainable development goals (SDGs).
- IBSA also works to amplify the voice of the Global South in international governance.
Concept of Poverty
Poverty as a Multi-Dimensional Phenomenon
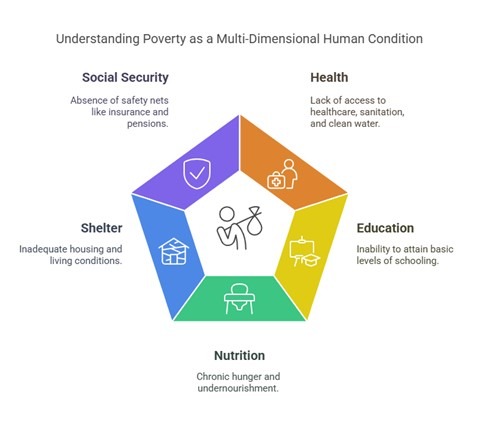
In modern development discourse, poverty is not merely about income deprivation, but a multi-dimensional condition affecting various aspects of human life.
This broader understanding includes deficits in:
- Health: Lack of access to healthcare, sanitation, and clean water.
- Education: Inability to attain even basic levels of schooling.
- Nutrition: Chronic hunger and undernourishment.
- Shelter: Inadequate housing and living conditions.
- Social Security: Absence of safety nets such as insurance, pensions, or unemployment benefits.
- Empowerment: Lack of decision-making power, especially among women and marginalized communities.
This holistic definition sees poverty not just as economic deficiency but as a condition where individuals lack the means to live with dignity.
Institutional Definitions and Endorsements
- UNDP (Human Development Report) and the World Bank (World Development Report) promote a comprehensive and integrated view of poverty.
- As per the UN (2001), poverty is:
“A human condition characterized by the sustained or chronic deprivation of the resources, capabilities, choices, security, and power necessary for the enjoyment of an adequate standard of living and other civil, cultural, economic, political, and social rights.”
This stresses that poverty is not just the absence of wealth but the absence of opportunities, security, and rights.
Amartya Sen’s Capability Approach
Renowned economist and Nobel Laureate Professor Amartya Sen revolutionized the way we look at poverty through his “Capability Approach.”
According to Sen:
Poverty arises when individuals lack the capabilities required to live a life they value.
This includes:
- Low income
- Poor health and education
- Inadequate access to resources
- Lack of autonomy and self-respect
Key Idea:
It’s not just what people earn, but what they are able to do or become with that income that determines poverty.
Thus, the focus shifts from “means” to “freedoms.”
Human Rights Approach to Poverty
Some scholars and international frameworks conceptualize poverty as a violation of human rights.
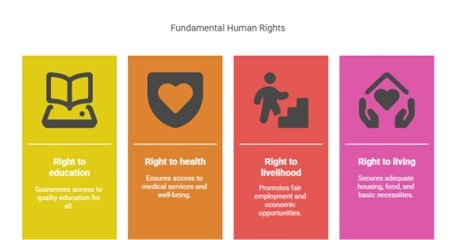
Under this approach, poverty is seen as a failure of the state or society to guarantee:
- Right to education
- Right to health
- Right to livelihood and employment
- Right to a decent standard of living
This perspective frames poverty as not just a socio-economic failure, but a denial of justice and human dignity.
Implication:
Eradicating poverty isn’t just about welfare—it’s about upholding basic human entitlements.
Summary of Key Concepts
Dimension | Explanation |
Income Poverty | Lack of sufficient financial resources. |
Multidimensional Poverty | Deficits in health, education, housing, etc. |
Capability Deprivation (Sen) | Inability to achieve desired life outcomes due to lack of freedom and resources. |
Rights-Based Poverty | Failure to ensure human rights and minimum entitlements. |
Institutional View (UN/World Bank) | Chronic deprivation across economic, political, and social dimensions. |
Identifying the Poor: Strategies and Categories
Introduction:
- The battle against poverty cannot be won without first identifying who the poor are.
- Mere allocation of funds or schemes is ineffective unless those most in need are accurately targeted.
- As the adage goes: “What gets measured, gets managed.”
Hence, establishing a robust poverty identification mechanism is vital for:
- Effective policy targeting
- Equitable distribution of benefits
- Monitoring development outcomes
Institutional Framework: India’s Journey in Poverty Estimation
India has consistently worked to build scientific and data-driven frameworks to identify and categorize poverty.
The task has largely been institutionalized through the efforts of the Planning Commission and later NITI Aayog.
Key Milestones:
Chronology of Poverty Estimation in India
Year | Body / Committee | Details & Contributions |
1950 | Planning Commission | – Established by the Government of India to formulate Five-Year Plans. – Initiated macro-level studies on poverty. – Emphasized the need for estimating poverty for effective planning. – Initially focused more on economic growth and less on specific poverty metrics. |
1962 | Study Group (Expert Group) | – First formal attempt to measure poverty scientifically. – Headed by V.M. Dandekar and N. Rath. – Linked poverty to calorie intake: minimum 2,250 calories per person/day. – Used National Sample Survey (NSS) consumption data. – Set the foundation for calorie-norm-based poverty lines in India. |
1979 | Task Force on Projections of Minimum Needs and Effective Consumption Demand | – Chaired by Y.K. Alagh. – Proposed separate rural and urban poverty lines, based on calorie norms: – 2,400 calories for rural – 2,100 calories for urban – Linked these calorie norms with monthly per capita consumption expenditure. – Poverty line based on cost of a basket of goods required to meet calorie intake. – Became the official methodology used for decades. |
1989 | Expert Group under D.T. Lakdawala | – Recommended that state-specific poverty lines be computed based on local price levels. – Continued reliance on consumption expenditure via NSS data. – Marked a shift toward cost-of-living adjustments at the state level. – Emphasized the need for comparability across time and space. |
2005 | Expert Group under Suresh Tendulkar | – Major departure from calorie-based norms. – Advocated a uniform poverty line across rural and urban areas, adjusted for price differences. – Introduced new poverty lines (Rs. 446.68 for rural, Rs. 578.80 for urban in 2004-05). – Estimated 37.2% of population below the poverty line in 2004-05. – Criticized for setting very low poverty thresholds, seen as underestimating poverty. |
2014 | Expert Group under C. Rangarajan | – Addressed criticisms of the Tendulkar Committee. – Rs. 1,407/month (Urban) for 2011-12. – Used normative levels of adequate nutrition, clothing, housing, transport, education, and health. – Estimated 29.5% of the population below the poverty line in 2011-12. – Provided two cut-off estimates: for basic needs and minimum social consumption. – Not adopted officially by the government, but significant academically. |
Comparison Table: Tendulkar vs Rangarajan Committee
Criteria | Tendulkar Committee (2009) | Rangarajan Committee (2014) |
Approach | Based on actual expenditure on health, education, and food | Based on normative minimum requirements |
Poverty Line (2011-12) | Rs. 816 (Rural), Rs. 1,000 (Urban) | Rs. 972 (Rural), Rs. 1,407 (Urban) |
% Below Poverty | 21.9% | 29.5% |
Calorie Norms | Not explicitly linked | 2,155 (Rural), 2,090 (Urban) |
Uniformity | Uniform across states with price adjustments | State-wise differentiation retained |
Additionally, individual economists have contributed by framing theoretical models and data-driven categorization of the population along the poverty spectrum.
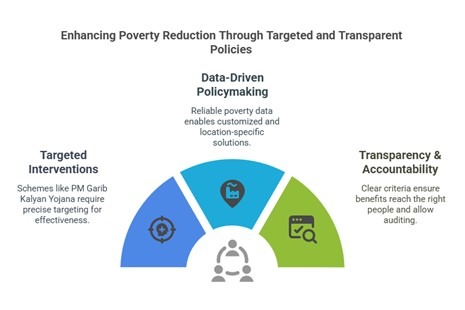
Why Accurate Identification is Critical
- Targeted Interventions Schemes like PM Garib Kalyan Yojana, Ujjwala Yojana, and PDS require precise targeting to be effective.
- Data-Driven Policymaking Reliable poverty data enables governments to craft customized and location-specific solutions.
- Transparency & Accountability Clear criteria for identification ensure that benefits reach the right people and allow effective auditing.
Need for Evolving Strategies
Modern poverty is complex, dynamic, and multi-layered. Identification methods must adapt to these realities.
1. Multidimensional Approach
- Income is not the sole determinant.
- Poverty should be assessed through MPI (Multidimensional Poverty Index) indicators:
- Education
- Health
- Standard of living (housing, water, sanitation, etc.)
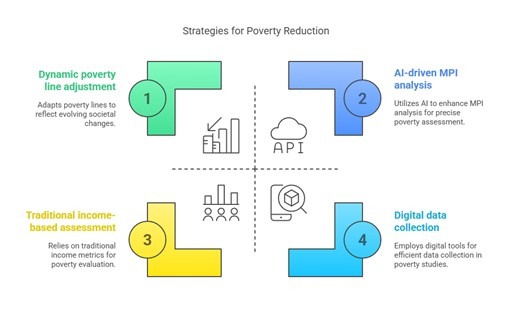
2. Dynamic Poverty Line
- Needs periodic revision to reflect:
- Inflation
- Changing consumption patterns
- Urbanization
- Lifestyle evolution
- Needs periodic revision to reflect:
3. Leveraging Technology
- Use of digital tools (Aadhaar-linked data, SECC, mobile surveys)
- Big data and AI analytics can help identify trends, assess eligibility, and prevent exclusion or duplication
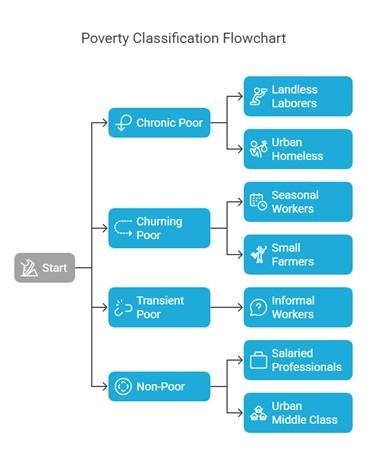
Categorizing the Poor
Poverty is not binary—it exists along a spectrum. Categorization helps in fine-tuning interventions.
Category | Description | Examples |
Chronic Poor | Consistently remain below poverty line | Landless laborers, urban homeless |
Churning Poor | Oscillate in and out of poverty | Seasonal workers, small farmers |
Transient Poor | Generally above the poverty line, but occasionally slip below it | Informal workers during crisis periods |
Non-Poor | Secure income and access to services | Salaried professionals, urban middle class |
Policy Insight:
- Chronic poor need long-term social protection and asset creation.
- Churning poor benefit from livelihood security and microcredit.
- Transient poor require shock-absorbers like health insurance and employment guarantees.
CAUSES OF POVERTY IN INDIA: A MULTIFACETED ANALYSIS
Poverty in India is not the result of a single factor but a complex interplay of institutional, social, and economic factors. Despite rapid economic growth, millions remain in poverty due to persistent structural barriers and policy gaps.
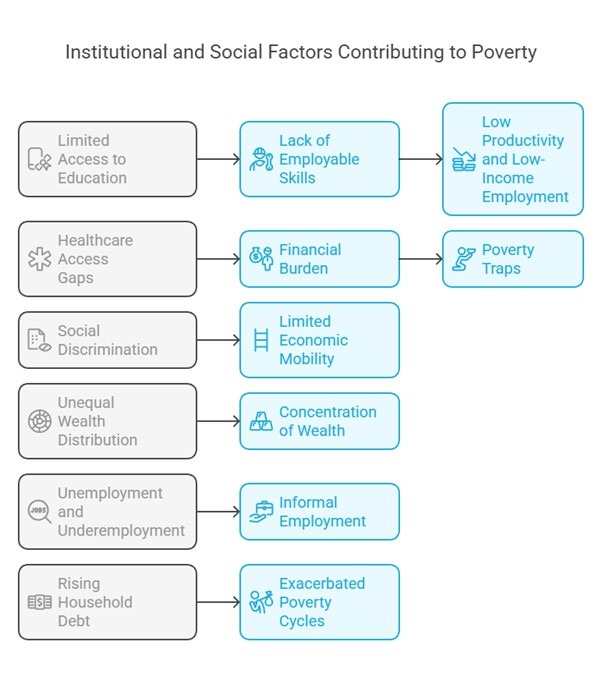
Institutional and Social Factors
🔹 Limited Access to Education and Skills
- Only 51.3% of India’s population aged 25 and above has completed secondary education (UNESCO, 2022).
- This education deficit leads to a lack of employable skills, perpetuating a cycle of low productivity and low-income employment, particularly in informal sectors.
🔹 Healthcare Access Gaps
- Out-of-pocket expenditure accounts for 47.1% of total health spending (NHA 2019–20).
- The absence of universal health coverage makes healthcare a major financial burden, pushing vulnerable families into poverty traps after medical emergencies.
🔹 Social Discrimination
- Caste-based exclusion and discrimination continue to limit economic mobility.
- Dalits earn 11% less than non-Dalits on average for similar work (World Bank, 2020), highlighting systemic inequity.
🔹 Unequal Wealth Distribution
- India’s Gini coefficient of 0.35 reflects growing income inequality (World Bank, 2023).
- The top 10% hold 51% of national income (IMF, 2022), concentrating wealth in the hands of a few and marginalizing the rest.
🔹 Unemployment and Underemployment
- While the unemployment rate stood at 7.8% in 2022 (World Bank), this masks deeper issues:
- Underemployment is widespread: 37% of the employed workforce desires more working hours (ILO, 2023).
- Informal employment remains dominant, with low job security and benefits.
- While the unemployment rate stood at 7.8% in 2022 (World Bank), this masks deeper issues:
🔹 Rising Household Debt
77% of rural and 55% of urban households reported being in debt (CMIE, 2022).
High interest rates from informal credit sources further exacerbate poverty cycles.
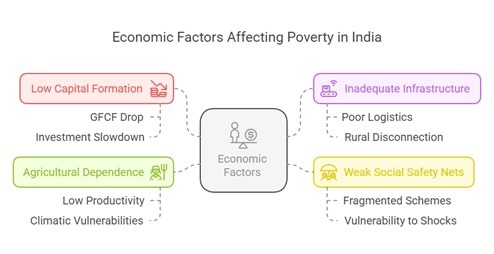
Economic Factors
🔹 Low Capital Formation
- India’s gross fixed capital formation (GFCF) dropped to 29% of GDP in 2022 (World Bank).
- Weak private and public investment slows job creation and industrial expansion, limiting avenues out of poverty.
🔹 Inadequate Infrastructure
- Ranked 38th in the World Bank’s Logistics Performance Index (2023), India struggles with:
- Poor roads, storage facilities, and logistics,
- Disconnected rural economies,
- Limited access to markets and opportunities.
- Ranked 38th in the World Bank’s Logistics Performance Index (2023), India struggles with:
🔹 Weak Social Safety Nets
- India’s welfare schemes are fragmented and unevenly implemented.
- In the absence of robust support systems, any shock—be it natural, financial, or health-related—can push households into poverty.
🔹 Agricultural Dependence
- 45% of the workforce is still employed in agriculture (NITI Aayog).
- The sector is marked by low productivity, seasonal employment, climatic vulnerabilities, and price volatility—offering little scope for sustainable income generation.
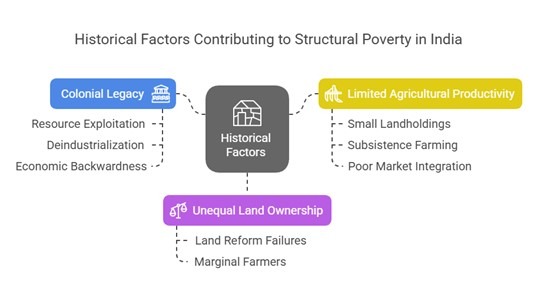
Historical Factors: Roots of Structural Poverty
🔹 Colonial Legacy
- British colonial rule (1757–1947) systematically exploited India’s resources, redirected agricultural surplus, and deindustrialized traditional industries, especially textiles.
- The economy was reoriented to serve British commercial interests, leaving a legacy of regional disparities, economic backwardness, and underdeveloped infrastructure that still affects India today.
🔹 Unequal Land Ownership
- Despite several land reform initiatives post-Independence, land ownership remains highly skewed.
- According to the World Bank (2018):
- 68% of rural households are either landless or own less than one hectare of land (marginal farmers).
- Despite several land reform initiatives post-Independence, land ownership remains highly skewed.
- The failure of land redistribution and tenancy reforms means millions are locked out of productive economic assets, reinforcing rural poverty.
🔹 Limited Agricultural Productivity
- Small and fragmented landholdings, lack of access to quality inputs, irrigation, and modern technology restrict agricultural output.
- Most smallholders are caught in subsistence farming, with low returns, high risks, and poor market integration.
- This impairs rural income growth, leading to perpetual poverty, especially in states like Bihar, Odisha, and Jharkhand.
Additional Structural and Contemporary Factors
🔹 Precarious Work and Informal Employment
- According to the ILO (2018), about 81% of non-agricultural workers are employed in the informal sector.
- These jobs are marked by:
- Low and irregular wages,
- Lack of job security,
- No social security benefits,
- Poor working conditions.
- This makes upward mobility extremely difficult for a large segment of the population.
🔹 Rising Prices and Inflation
- Inflation, particularly in food and fuel, hits the poor hardest as they spend a larger share of their income on basic necessities.
- Even moderate inflation can significantly erode real incomes of the poor, aggravating nutrition insecurity and increasing their reliance on loans.
🔹 Inequitable Distribution of Resources
- Access to quality education, healthcare, financial services, clean drinking water, and employment opportunities remains unequal across regions, castes, and gender lines.
- Urban-rural, inter-state, and intra-state inequalities sustain cycles of deprivation, making poverty a persistent structural challenge.
🔹 Impact of the COVID-19 Pandemic
- The pandemic disproportionately impacted the informal sector, where the majority of India’s poor are employed.
- According to CMIE and Azim Premji University:
- Over 230 million Indians were pushed below the poverty line during the first year of the pandemic.
- Women, migrants, and daily wage workers were among the worst hit, with job losses, salary cuts, and reverse migration contributing to widespread distress.
Path Ahead: Breaking the Cycle of Poverty
- To effectively address the causes of poverty in India, a multi-pronged, long-term strategy is required:
✅ Human Capital Investment
- Universal access to quality education, skill training, and healthcare.
- Strengthening institutions like Anganwadis, ASHA workers, and midday meals to break intergenerational poverty.
✅ Inclusive Economic Growth
- Diversify agriculture, promote MSMEs, and generate non-farm employment.
- Foster rural-urban linkages and improve connectivity to markets.
Robust Social Safety Nets
- Expand and streamline schemes like PM-KISAN, MGNREGA, and Ayushman Bharat.
- Introduce universal basic services in health, education, and nutrition.
Address Institutional Inequities
- Enforce land reforms, promote financial inclusion, and ensure equity in governance and justice delivery.
MULTIDIMENSIONAL POVERTY INDEX (MPI)
The Multidimensional Poverty Index (MPI) provides a holistic perspective on poverty by recognizing that poverty is not solely defined by income levels. Instead, it takes into account a wide range of deprivations such as poor health, lack of education, and inadequate living standards. This approach expands on the traditional income-based poverty measures, offering a more nuanced understanding of poverty’s complex and multi-faceted nature.
1. What is MPI?
The Multidimensional Poverty Index (MPI) measures acute poverty by evaluating overlapping deprivations across various indicators. Unlike the World Bank’s income poverty measure (which focuses on extreme poverty, i.e., those living below $1.90/day), MPI includes several dimensions of poverty, providing a more comprehensive view of people’s well-being.
The MPI was developed by the UN Development Programme (UNDP) and the Oxford Poverty and Human Development Initiative (OPHI) and was introduced in 2010 to offer a richer understanding of poverty beyond income.
2. Key Features of MPI
- Holistic View: MPI focuses on multiple dimensions of poverty, recognizing that deprivation in one area (e.g., education) often overlaps with deprivation in others (e.g., health, housing).
- Focus on Acute Poverty: MPI identifies not just those below a specific income threshold but also those suffering from multiple deprivations simultaneously.
- Replacement of the Human Poverty Index: MPI replaced the older Human Poverty Index (HPI) by shifting the focus from income to a wider range of living conditions.
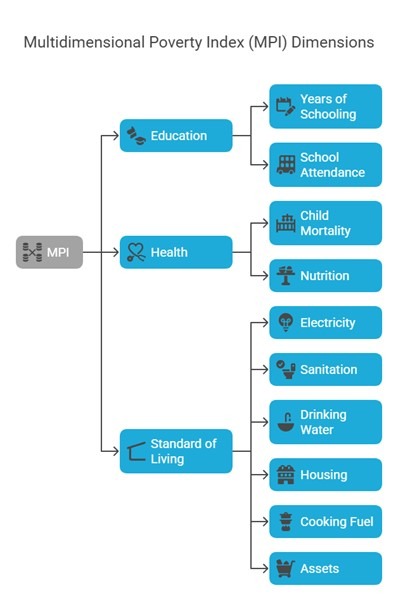
MPI’s use of 10 specific indicators across three dimensions (Education, Health, and Standard of Living) allows for a more detailed and accurate picture of poverty.
3. The Three Dimensions of MPI
A. Education
Education is a critical component of poverty as it impacts long-term economic and social mobility. The MPI includes two education-related indicators:
1. Years of Schooling:
- Deprived if no household member (≥ 10 years old) has completed 6 years of schooling.
- Weight: 1/6th of the MPI.
- Related SDG: SDG 4 (Quality Education).
2. School Attendance:
- Deprived if any school-aged child is not attending school up to class VIII.
- Weight: 1/6th of the MPI.
- Related SDG: SDG 4 (Quality Education).
B.Health
Health is another critical dimension, as good health is essential for a productive life. MPI includes two health-related indicators:
1. Child Mortality:
- Deprived if any child in the family has died in the last 5 years.
- Weight: 1/6th of the MPI.
- Related SDG: SDG 3 (Good Health and Well-Being).
2. Nutrition:
- Deprived if any adult (under 70) or child is stunted.
- Weight: 1/6th of the MPI.
- Related SDG: SDG 2 (Zero Hunger).
C. Standard of Living
Living standards directly reflect the quality of life and access to essential services. MPI includes six indicators related to living standards:
1. Electricity:
- Deprived if the household has no electricity.
- Weight: 1/18th of the MPI.
- Related SDG: SDG 7 (Affordable and Clean Energy).
2. Sanitation:
- Deprived if there is no improved sanitation facility or if shared with other households.
- Weight: 1/18th of the MPI.
- Related SDG: SDG 6 (Clean Water and Sanitation).
3. Drinking Water:
- Deprived if there is no safe drinking water, or it is more than a 30-minute round-trip walk to access it.
- Weight: 1/18th of the MPI.
- Related SDG: SDG 6 (Clean Water and Sanitation).
4. Housing:
- Deprived if the household does not have adequate housing material for roof, walls, and floor, or if the materials used are natural (e.g., mud, straw, etc.).
- Weight: 1/18th of the MPI.
- Related SDG: SDG 11 (Sustainable Cities and Communities).
5. Cooking Fuel:
- Deprived if the household uses dung, wood, charcoal, or coal for cooking.
- Weight: 1/18th of the MPI.
- Related SDG: SDG 7 (Affordable and Clean Energy).
6. Assets:
- Deprived if the household does not own any of the following: radio, TV, telephone, computer, animal cart, bicycle, motorbike, refrigerator, or car/truck.
- Weight: 1/18th of the MPI.
- Related SDG: SDG 1 (No Poverty).
4. How MPI is Calculated
- Deprivation Scoring: Each indicator is scored as either deprived (1) or not deprived (0). If a household is deprived in one of the 10 indicators, it is assigned a score of 1 for that indicator.
- Identifying Poor Households: A person or household is considered multidimensionally poor if they are deprived in at least one-third of the weighted indicators. This threshold reflects the extent to which a person experiences overlapping deprivations.
- MPI Value: The MPI value is calculated by considering the incidence of poverty (how many are poor) and the intensity (how severe the deprivation is).
5. Why is MPI Important?
➤ A Holistic Approach:
- The MPI captures multiple aspects of poverty, which income-based measures miss. This enables governments to design more targeted interventions that address the specific deprivations affecting poor populations.
➤ Focus on Acute Poverty:
- By focusing on people who face overlapping deprivations, MPI identifies those who are the most vulnerable and at risk of being left behind in development policies.
➤ Global Comparisons:
- MPI allows for cross-country comparisons on poverty and development, tracking progress toward Sustainable Development Goals (SDGs).
➤ Policy Formulation:
- The MPI can help governments allocate resources to areas that need the most attention, such as education, health, sanitation, and housing, ensuring more inclusive growth.
6. India and MPI
India has made strides in reducing multidimensional poverty through various programs like Mahatma Gandhi National Rural Employment Guarantee Act (MGNREGA), Pradhan Mantri Awas Yojana, and Swachh Bharat Abhiyan. However, significant disparities remain, particularly in rural areas and marginalized communities.
For example, as per the Global MPI 2020:
- India’s MPI value was 0.123, indicating a substantial proportion of the population still faces multiple deprivations across various dimensions.
Key Findings of MPI 2023
Global Reduction in MPI Values:
The Multidimensional Poverty Index (MPI) report reveals a significant achievement: 25 countries, including India, have successfully halved their MPI values over the past 15 years. This demonstrates global progress in alleviating multidimensional poverty, which includes factors such as education, health, and living standards, beyond just income.
India-Specific Data:
- 415 million People Lifted Out of Poverty:
From 2005-06 to 2019-21, a remarkable 415 million people in India have moved out of multidimensional poverty. This significant progress highlights the country’s efforts to address the multiple deprivations that contribute to poverty.
Diminishing Deprivation Across Indicators:
The report indicates that deprivation across the 10 MPI indicators has reduced in India. Notably, the poorest states, children, and marginalized caste groups have seen the fastest improvement. These findings suggest that India’s poverty alleviation strategies are reaching those who need them most.
Global Poverty Statistics (2023):
- 1.1 billion People: Over 1.1 billion people worldwide, or 18% of the global population, continue to live in acute multidimensional poverty. This underscores the widespread nature of poverty, even as some countries, like India, have made remarkable strides in addressing it.
India’s Achievements and Social Development Schemes:
Impact of Social Development Schemes:
The report acknowledges that India’s success in reducing poverty is, in part, attributed to social development schemes launched by the current government. These schemes have significantly improved access to basic services like healthcare, education, sanitation, and housing for the most disadvantaged populations.
Despite Economic Growth Criticisms:
While India’s rapid economic growth has faced criticism for not benefiting the poorest, these findings suggest that the growth has had a positive impact on poverty reduction. The success of poverty reduction programs has been facilitated by the government’s focus on inclusive growth, ensuring the benefits reach the poorest segments of society.
Pandemic Impact:
Despite significant poverty reduction, the COVID-19 pandemic may have had a reversing effect on some of the progress made in poverty alleviation. However, the lack of sufficient data on the full effects of the pandemic on poverty levels prevents drawing conclusive statements about this impact. Thus, India must continue its direct poverty relief efforts while pursuing economic growth.
National Multidimensional Poverty Index (MPI) – 2023 Review
The National Multidimensional Poverty Index (MPI), released by NITI Aayog in its second edition titled “National Multidimensional Poverty Index: A Progress Review 2023,” customizes the global MPI to fit India’s priorities. The MPI used by India takes into account dimensions, indicators, weights, and cut-offs that reflect the country’s specific goals and circumstances.
Key Objectives and Focus of the MPI:
- SDG Target 1: The main objective of India’s MPI is to meet Sustainable Development Goal (SDG) Target 1, which aims to reduce poverty in all its forms by at least 50% by 2030. This aligns India’s poverty reduction strategy with global goals, while also addressing national-specific needs.
Progress in Key Areas:
India has made notable progress in improving access to essential services for its poorest populations. These areas include:
- Sanitation: Improved access to clean sanitation facilities.
- Nutrition: Increased focus on improving the nutritional standards of the population.
- Cooking Fuel: Expansion of access to cleaner cooking fuel, reducing reliance on harmful fuels like wood and coal.
- Drinking Water: Enhanced accessibility to safe drinking water.
- Electricity: Greater access to reliable electricity, especially in rural and underserved areas.
- Financial Inclusion: Progress in expanding financial services to marginalized communities, promoting economic empowerment.
Impact of these Improvements on Poverty:
According to NITI Aayog’s report, these concerted efforts have contributed to a decline in multidimensional poverty across India, especially in areas related to education, nutrition, and sanitation. These improvements have been critical in reducing overall poverty and raising living standards for marginalized and disadvantaged groups.
Key Indicators and Weights in the National MPI:
While the MPI takes into account several indicators, the key dimensions and their associated weights help determine the overall poverty index:
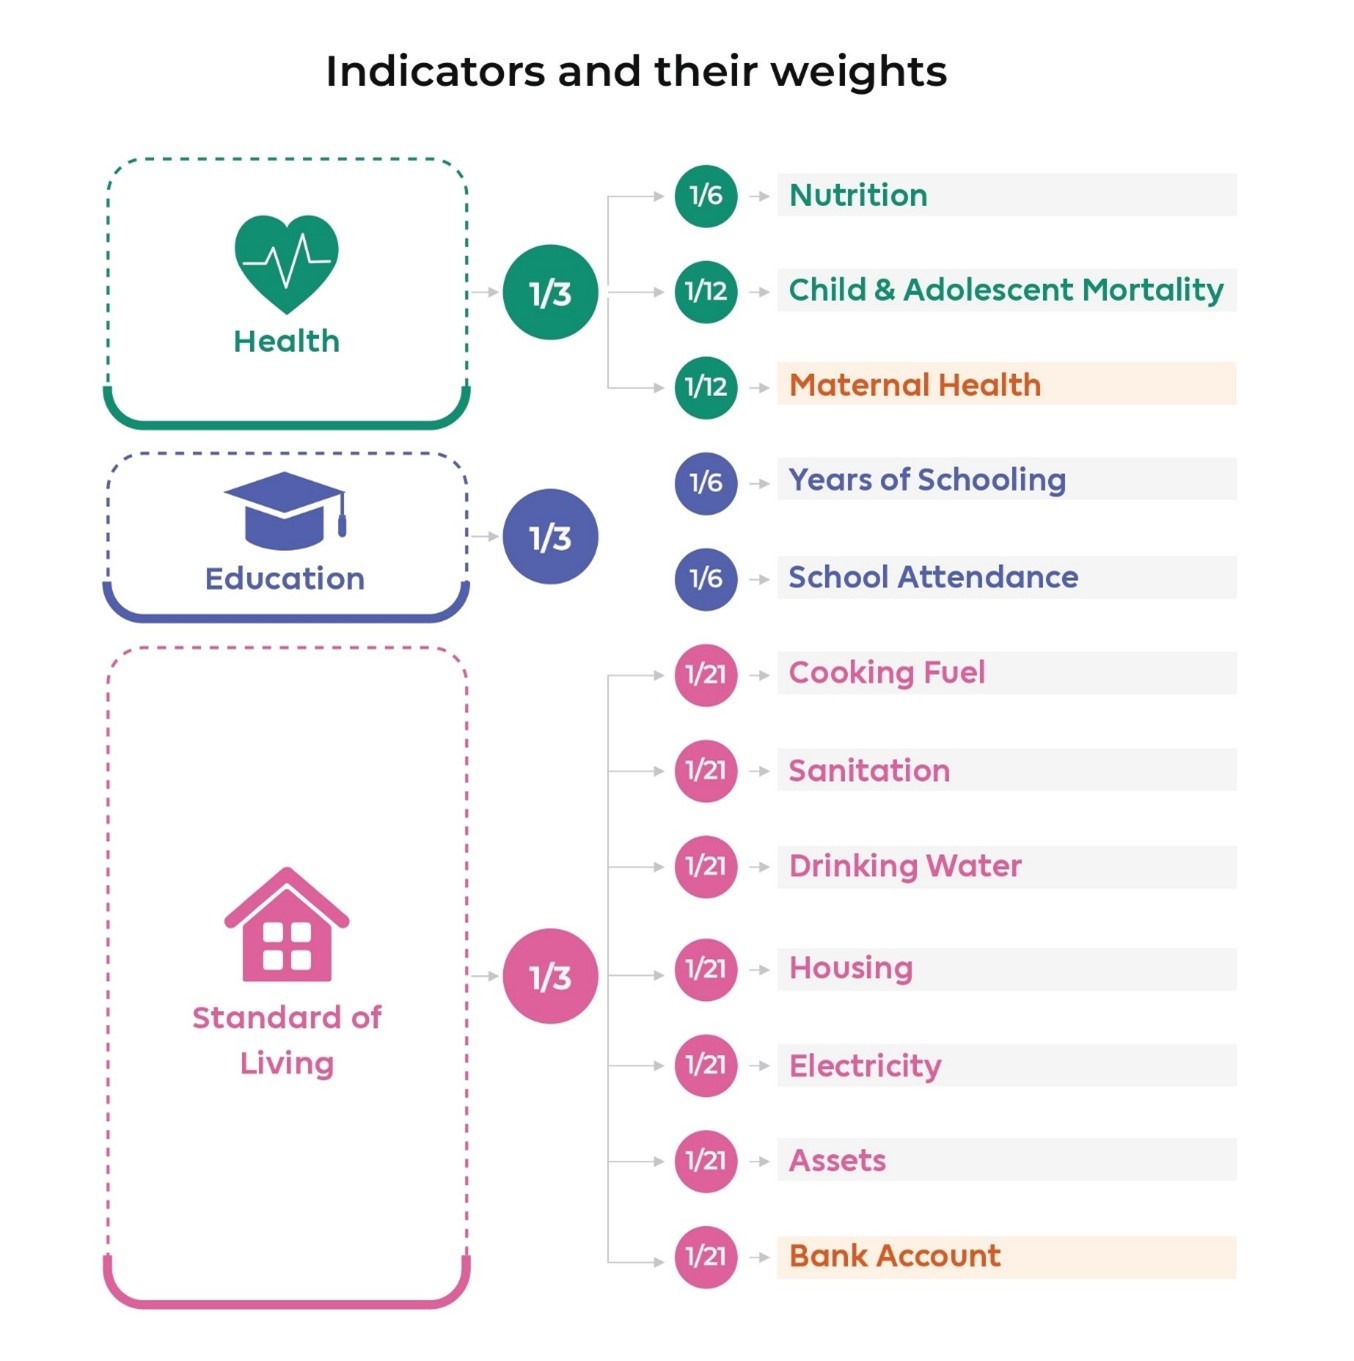
Each of these indicators reflects India’s development priorities, particularly in addressing fundamental human needs such as health, education, and living conditions.
Differences Between Income-Based and Consumption Expenditure-Based Poverty Lines
The debate between income-based and consumption expenditure-based poverty lines revolves around the most accurate and practical method to measure poverty. The National Sample Survey Office (NSSO) has argued in favor of a consumption expenditure-based poverty line due to several reasons:
1. Income Stability vs. Consumption Stability:
Income-Based Poverty Line:
- Income is often irregular for many households, particularly those working in the informal sector. For example, daily wage earners or self-employed individuals might have fluctuating incomes due to seasonal variations or other external factors.
- Income fluctuations can make it challenging to assess the true economic well-being of households over time.
Consumption Expenditure-Based Poverty Line:
- In contrast, consumption patterns tend to remain more stable than income. Even if a household’s income fluctuates, their spending on basic necessities (such as food, clothing, and shelter) often follows a more predictable pattern.
- Consumption better reflects the actual standard of living and provides a clearer picture of a household’s well-being, as it shows how much they can afford to consume rather than just how much they earn.
2. Feasibility of Computation:
Income-Based Poverty Line:
- Estimating a poverty line based on income can be more complex and prone to error, especially when incomes are irregular or variable.
- Additionally, calculating income from various sources (including informal, non-cash earnings) can be difficult and inconsistent.
Consumption Expenditure-Based Poverty Line:
- The consumption expenditure approach is generally seen as more feasible and reliable. By examining how much people are spending on goods and services, this method is less susceptible to fluctuations in income and is simpler to calculate using data from household consumption surveys.
- The use of Uniform Reference Period (URP), Mixed Reference Period (MRP), and Modified Mixed Reference Period (MMRP) helps to adjust for various time periods, making consumption expenditure more stable and accurate for measurement purposes.
3. Advantages of Consumption-Based Approach:
- The Rangarajan Committee (2014) and World Bank (2015) both endorsed the use of MMRP (Modified Mixed Reference Period) over traditional income-based measures and the URP/MRP methods.
- The MMRP method, combining various recall periods for different items, offers a better picture of living standards and poverty levels.
Comparative Analysis of Poverty Measurement Methods
- Here is a comparison of the different poverty measurement methods:
Three poverty estimation methods used by the National Sample Survey Office (NSSO) in India: URP, MRP, and MMRP, and how they differ in terms of methodology and their impact on poverty estimates.
1. URP (Uniform Reference Period)
🔹 Definition:
- In the Uniform Reference Period, data on all consumption items (food and non-food) are collected using a 30-day recall period.
- This means respondents are asked to recall their consumption of every item over the past 30 days.
🔹 Impact on Poverty Estimation:
- Yields the highest poverty estimates.
- This is because:
- People tend to forget or underreport infrequently purchased items (like clothes, footwear, durable goods, etc.) when asked to recall over a short 30-day period.
- This leads to an underestimation of total consumption expenditure.
- As a result, more households appear to fall below the poverty line.
🔹 Example:
If a household buys shoes once in 6 months, they might not mention it in a 30-day recall, underestimating their actual spending capacity.
2. MRP (Mixed Reference Period)
🔹 Definition:
- In the Mixed Reference Period, the NSSO collects:
- Food items and some essentials (like fuel, clothing) using a 30-day recall.
- Low-frequency non-food items (like clothing, footwear, durable goods, education, health) using a 365-day recall.
- In the Mixed Reference Period, the NSSO collects:
🔹 Impact on Poverty Estimation:
- Provides a lower estimate of poverty than URP, but higher than MMRP.
- Why?
- It captures infrequent and higher-value purchases more accurately using the longer recall period.
- Therefore, it records a higher level of consumption, making fewer people appear poor.
🔹 Example:
If a household bought a refrigerator in the past year, it would be included in the consumption total, giving a better picture of real expenditure.
3. MMRP (Modified Mixed Reference Period)
🔹 Definition:
- The Modified Mixed Reference Period improves further by using different recall periods for different item groups:
- Food: 7-day recall (to reduce recall error and capture variations)
- Frequently purchased non-food items (like fuel, light, etc.): 30-day recall
- Infrequently purchased non-food items (like clothing, education, durables): 365-day recall
- The Modified Mixed Reference Period improves further by using different recall periods for different item groups:
🔹 Impact on Poverty Estimation:
- Gives the lowest poverty estimate.
- Because it uses tailored recall periods, it captures:
- Frequent and infrequent consumption more precisely
- Results in the most accurate measure of total household expenditure.
- Hence, fewer people fall below the poverty line.
🔹 Example:
Daily milk consumption is captured better over a 7-day recall, while rare purchases like medical surgeries are not missed in a 365-day recall.
Summary Comparison Table:
Method | Recall Period | Consumption Accuracy | Poverty Estimate |
URP | 30 days for all items | Low (misses infrequent spending) | Highest |
MRP | 30 days (food), 365 days (non-food) | Medium | Moderate |
MMRP | 7 days (food), 30 days (frequent non-food), 365 days (rare non-food) | High (most precise) | Lowest |
INEQUALITY
Inequality encompasses any lack of balance or disparity among individuals or groups across various dimensions in society. It can be structured into several categories beyond just economic or social dimensions:
- Economic Inequality: Beyond income and wealth, this can include disparities in access to jobs, capital, and other economic resources.
- Social Inequality: Captures differences in social status and access to services such as education, healthcare, and housing, often influenced by gender, race, ethnicity, or religion.
- Political Inequality: Involves disparities in political power and influence, often reflected in unequal representation or participation in political processes and decision-making.
- Environmental Inequality: Refers to the disproportionate exposure of certain groups to environmental hazards, such as pollution or natural disasters, often linked to socio-economic status.
- Health Inequality: Differences in health outcomes and access to healthcare services, which can be affected by geography, socio-economic status, and other demographic factors.
- Cultural Inequality: Differences in the representation and valuation of cultural identities and practices. This can affect how certain cultural groups are perceived and treated in broader society.
- Educational Inequality: Disparities in access to quality education and learning resources, often reflecting broader socio-economic divides.
Inequality is a complex issue that often intersects with various social, political, and economic factors. It requires multifaceted approaches to address, including policy changes, social reforms, and concerted efforts from governments, organizations, and individuals to foster equity and inclusion across all levels of society.
Methods to Assess Income Inequality
Assessing income inequality is crucial for understanding how wealth is distributed within a nation. Two primary methods for evaluating income inequality include the Gini Coefficient and the Lorenz Curve, both of which are widely used in economic analysis.
Gini Coefficient
Origin and Purpose
- Developed by: The Gini Coefficient was developed by Corrado Gini, an Italian statistician, in 1912.
- Purpose: It was designed to measure the extent of income inequality within a population.
Calculation
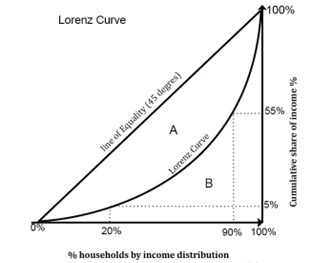
1. Lorenz Curve:
- The Lorenz Curve is a graphical representation of income distribution. It plots the cumulative percentage of total income earned by the bottom x% of the population.
- The x-axis represents the cumulative percentage of the population, while the y-axis shows the cumulative percentage of income.
2. Calculation Process:
- Perfect Equality Line: The line of perfect equality is a 45-degree line that represents a scenario where each percentage of the population earns exactly that percentage of the total income.
- Area Measurement: The Gini Coefficient is calculated by finding the area between the line of perfect equality and the Lorenz Curve. Specifically, it is the ratio of this area (A) to the total area under the line of perfect equality (A + B).
Interpretation
Range:
- 0 (Perfect Equality): All members of the society earn the same amount of income.
- 1 (Perfect Inequality): All income is concentrated in the hands of a single individual.
Practical Interpretation:
- A lower Gini Coefficient indicates more equal income distribution.
- A higher Gini Coefficient suggests greater income inequality, signifying a wider gap between the wealthiest and the poorest in the population.
Economic and Social Implications
Economic Impact:
- Consumer Spending: High inequality can limit overall consumer spending since wealth is concentrated in the hands of fewer individuals.
- Economic Growth: Persistent inequality might stifle economic growth by restricting access to education and economic opportunities for a large portion of the society.
Social Consequences:
- Social Tension: High levels of inequality can lead to dissatisfaction and unrest.
- Mobility: It can reduce social mobility, making it harder for individuals from lower-income groups to improve their economic status.
Global Perspective
- Different countries have varied Gini Coefficients, influenced by their economic policies, social systems, and cultural factors.
- Policymakers use the Gini Coefficient to assess and compare income inequality across regions and implement policies to address disparities.
Understanding the Gini Coefficient and its implications helps in formulating strategies to promote equitable economic development and social welfare.
Lorenz Curve Overview
The Lorenz Curve is a critical graphical tool used to illustrate income or wealth distribution within a population. It helps visualize the degree of income inequality and serves as a foundational concept that complements the Gini Coefficient. Below is a detailed explanation of the Lorenz Curve’s characteristics, interpretation, and significance.
Characteristics of the Lorenz Curve
1. Axes:
- X-axis (Cumulative Population Share): Represents the cumulative percentage of individuals or households, ranked from the poorest to the richest. It ranges from 0% to 100%.
- Y-axis (Cumulative Income Share): Represents the cumulative percentage of total income earned by the corresponding cumulative percentage of the population. It also ranges from 0% to 100%.
2. Graphical Representation:
- The Lorenz Curve plots the relationship between the proportion of income earned and the proportion of people earning that income.
- A 45-degree line, known as the line of perfect equality, represents a hypothetical situation where income is equally distributed among all individuals (e.g., if 20% of the population earns 20% of the income).
Lorenz Curve Explained
Perfect Equality:
- The straight 45-degree line signifies perfect equality, where every segment of the population earns an equal share of total income.
Actual Income Distribution:
- The Lorenz Curve, which lies below the line of perfect equality, indicates the actual distribution of income in the population.
- The more pronounced the curve (the further it bows from the line of perfect equality), the greater the income inequality in that society.
Interpretation of the Curves:
- The area between the Lorenz Curve and the line of perfect equality indicates the level of inequality; the larger this area, the higher the income inequality.
- Conversely, if the Lorenz Curve closely approaches the line of perfect equality, it indicates a more equitable distribution of income.
Area Under the Lorenz Curve
Shaded Area ‘A’:
- The area ‘A’ represents the space between the Lorenz Curve and the line of perfect equality.
- The Gini Coefficient can be derived from this area:
Where:
- A is the area between the Lorenz Curve and the line of perfect equality, which quantifies the degree of inequality.
- B is the area under the Lorenz Curve.
Perfect Equality and Gini Coefficient
Perfect Equality Condition:
- If the area A = 0, the Lorenz Curve coincides with the line of perfect equality. This indicates a scenario of perfect equality, where everyone has the same income.
- In such cases, the Gini Coefficient would equal 0.
Significance of the Lorenz Curve
1. Policy Tool:
- The Lorenz Curve is used by economists and policymakers to assess the impact of economic policies on income distribution and to identify areas for intervention.
2. Visual Comparison:
- It allows for easy visual comparisons of income inequality across different populations or countries, aiding in understanding social and economic disparities.
3. Educational Value:
- The visual nature of the Lorenz Curve makes it an effective teaching tool for explaining income distribution concepts in economics and social sciences.
In summary, the Lorenz Curve effectively illustrates the extent of income inequality within a society and provides a visual basis for understanding how income is distributed among its members. Its relationship with the Gini Coefficient allows for quantitative analysis of inequality and its implications for social and economic policies