
Circular Flow of Income
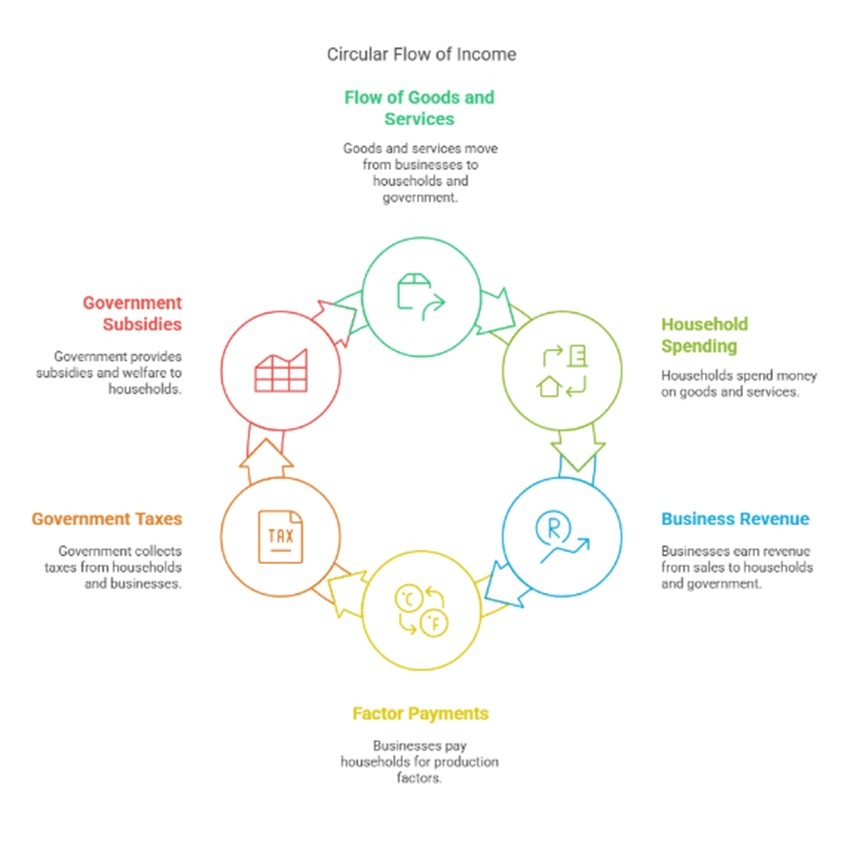
The circular flow of income is a fundamental concept in economics that demonstrates how money and resources move through an economy. It provides a simplified model of complex economic interactions among various sectors, including households, businesses, government, and the rest of the world.
Key Components of the Circular Flow of Income:
1. Households
- Role: Households are the primary consumers in the economy. They provide the factors of production (land, labour, capital, and entrepreneurship) to businesses.
- Income Generation: In exchange for providing these resources, households receive income in the form of wages, rent, interest, and profits.
- Consumption: They use this income to buy goods and services produced by businesses, which directly drives demand in the economy.
2. Businesses
- Production: Businesses utilize the factors of production from households to create goods and services. This production is essential for satisfying consumer needs.
- Sales and Income: Businesses sell their products to households and other businesses. The revenue earned from these sales is used to pay wages, rent, and dividends, creating a cycle of income distribution.
3. Government
- Taxation: The government collects taxes from both households and businesses. This revenue is crucial for funding public services and infrastructure.
- Public Goods and Services: Governments use tax revenues to provide essential services like education, healthcare, transportation, and social welfare programs, benefiting the population and contributing to overall economic stability.
4. Rest of the World
- International Trade: This component encompasses all economic transactions with foreign countries. It includes imports (goods and services purchased from abroad) and exports (goods and services sold to other countries).
- Impact on the Economy: The rest of the world influences the domestic economy by providing access to foreign markets for businesses and creating additional consumer choices for households.
Significance of the Circular Flow of Income:
1. Interconnectedness of Sectors:
- It highlights the interdependence between households, businesses, the government, and the foreign sector. A change in one sector directly impacts the others, creating a dynamic economic environment.
2. Understanding Money Movement:
- The model is essential for understanding how money circulates in an economy, demonstrating that all economic activity revolves around this movement of resources and income.
3. Ripple Effects of Economic Changes:
- The circular flow illustrates how changes—such as a rise in government spending, a boom in exports, or a change in consumer habits—can affect the entire economy, influencing growth, employment, and overall economic health.
Limitations of the Circular Flow of Income:
1. Assumption of Perfect Competition:
- The model assumes that all markets operate under perfect competition, which is rarely the case in real-world economies. Market imperfections can significantly alter the flow dynamics.
2. Exclusion of Financial Institutions:
- Financial institutions, such as banks, play a crucial role in the economy by providing credit and facilitating transactions. The circular flow model does not integrate their influence, limiting its comprehensiveness.
3. Omission of Aggregate Demand and Supply:
- The model does not explicitly consider aggregate demand and supply, which are critical for understanding broader economic fluctuations and policies.
The circular flow of income is a foundational concept that helps to clarify the interactions within an economy. While it simplifies complex relationships, it effectively provides insights into how different sectors work together, illustrating the movement of money and resources. Despite its limitations, it serves as a valuable framework for understanding economic principles and the impact of various factors on overall economic health.
TYPES OF CIRCULAR FLOW OF INCOME
1. Circular Flow of Income in a Two-Sector Economy
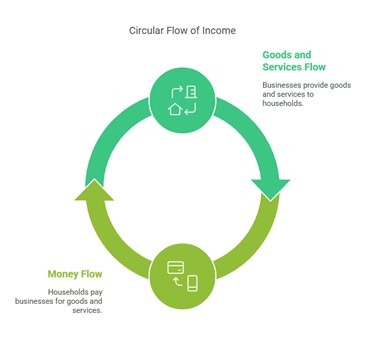
The two-sector model is the simplest representation of the circular flow of income. It illustrates how money and resources circulate between two core economic agents:
1. Households
2. Firms
This basic framework lays the groundwork for understanding how income is generated and spent in an economy.
1. Key Components of the Two-Sector Model
A. Households: Resource Owners and Consumers
Households own all the factors of production—namely:
- Labor
- Land
- Capital
- Entrepreneurial skills
They supply these resources to firms in exchange for income.
Household Activities
Provide factor services to firms (labor, capital, etc.)
Receive income:
- Wages (for labor)
- Rent (for land)
- Interest (for capital)
- Profit (for entrepreneurship)
- Use income entirely for consumption of goods and services produced by firms.
B. Firms: Producers and Employers
Firms hire resources from households and use them to produce goods and services.
Firm Activities:
- Employ factors of production
- Pay factor incomes to households
- Produce goods and services
- Sell output to households
- Receive revenue from households through consumption
2. Flows in the Two-Sector Model
The model includes two types of flows:
A. Real Flows (Physical Flows):
From Households to Firms:
- Factors of production (labor, land, capital, entrepreneurship)
From Firms to Households:
- Goods and services (produced using the supplied resources)
B. Money Flows (Financial Flows):
From Firms to Households:
- Factor payments (wages, rent, interest, profit)
From Households to Firms:
- Consumption expenditure (purchase of goods and services)
These flows form a closed loop, creating a circular pattern of income and expenditure.
3. Continuous Circular Nature
The circular flow illustrates how income and output circulate in the economy:
1. Households supply resources → Firms use them to produce goods.
2. Firms pay incomes → Wages, rent, interest, and profits flow to households.
3. Households spend their income → Firms earn revenue from selling goods.
4. Firms reinvest this revenue → Pay for more resources from households.
This creates a self-sustaining loop, as long as households continue to spend and firms continue to produce.
4. Assumptions of the Two-Sector Model
To simplify analysis, several assumptions are made:
1. Closed Economy
- No interaction with foreign countries.
- No exports or imports.
2. No Government
- No taxes or government spending.
- No regulation or public services.
3. No Savings or Investment
- Households spend all their income on consumption.
- Firms use all their revenue to pay for factor services.
- No banking or financial institutions are included.
4. Perfect Competition
- Households and firms are price takers.
- No single actor can influence prices in the markets.
5. Diagrammatic Representation
A simplified two-sector circular flow can be illustrated with two concentric loops:
Outer Loop (Real Flow):
- Goods and Services: Firms → Households
- Factors of Production: Households → Firms
Inner Loop (Monetary Flow):
- Consumption Expenditure: Households → Firms
- Factor Payments: Firms → Households
6. Limitations of the Two-Sector Model
While useful as an introductory model, it is highly idealized and does not reflect the complexity of modern economies.
- No role for savings or investment
- Ignores government intervention
- Excludes international trade
- Doesn’t account for financial markets
- Assumes full income spending and no leakages
Thus, this model serves as a foundation, which is expanded in three-sector and four-sector models to reflect more realistic economic scenarios.
2. The Circular Flow of Income in a Three-Sector Economy
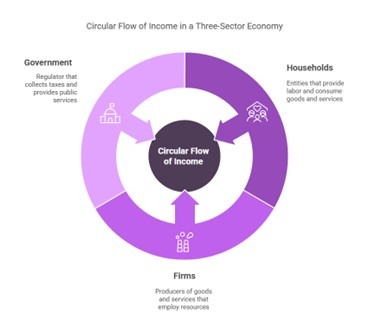
In macroeconomics, the circular flow of income is a model that illustrates the movement of money, resources, and goods and services in an economy. In a three-sector model, the primary actors are:
- Households
- Firms
- Government
This model builds upon the two-sector economy (households and firms) by adding the government, thereby making it more realistic and aligned with actual modern economies.
1. Households: The Factor Providers and Consumers
Households are the owners of the factors of production: land, labor, capital, and entrepreneurship. They play a dual role in the economy:
A. Supplying Factors of Production:
- Households sell their labor, lend capital, allow the use of their land, and engage in entrepreneurial activities.
- These resources are purchased by firms to produce goods and services.
B. Receiving Factor Income:
In exchange for their resources, households receive income in various forms:
- Wages for labor
- Rent for land
- Interest for capital
- Profit for entrepreneurship
This income forms the basis of their purchasing power.
C. Consuming Goods and Services:
- Households use their income to buy goods and services from firms. This spending is called consumption expenditure, which is a key driver of demand in the economy.
D. Paying Taxes:
A portion of household income is taxed by the government.
- These may be direct taxes (income tax) or indirect taxes (GST/VAT on purchases).
- Taxes are a leakage from the circular flow—they reduce household consumption potential but fund government activities.
2. Firms: The Producers of Goods and Services
Firms are the productive units in the economy. Their primary role is to combine factors of production to produce goods and services.
A. Hiring Factors of Production:
- Firms demand labor, capital, land, and entrepreneurship from households.
- They pay households for these services through factor incomes.
B. Producing Output:
- Using the inputs, firms manufacture goods and services, which are then sold in the market.
- The scale and efficiency of this production affect economic growth and employment.
C. Selling to Households and Government:
Firms earn revenue by selling:
- Consumer goods to households
- Goods and services to the government for public use or investment (like construction, defense, public transport)
D. Paying Taxes:
Firms also pay taxes to the government, including:
- Corporate taxes
- Production taxes
- Sales taxes
Like household taxes, these are leakages from the circular flow but essential for funding public expenditure.
3. Government: The Regulator and Redistributor
The government plays a crucial role in influencing and stabilizing the economy. It interacts with both households and firms in multiple ways.
A. Collecting Taxes:
The government levies taxes on both:
- Households (income tax, consumption tax)
- Firms (corporate tax, GST, excise duty)
These tax collections are used for public spending, but they temporarily withdraw money from the flow, reducing consumption and investment.
B. Spending on Goods and Services:
The government spends tax revenue (and borrowed funds) on:
- Public goods (roads, schools, hospitals)
- Services (law enforcement, sanitation, defense)
This spending injects money back into the economy by increasing demand for goods and services produced by firms.
C. Providing Transfer Payments:
The government also redistributes income through transfer payments, such as:
- Unemployment benefits
- Pensions
- Subsidies
- Welfare payments
These are non-reciprocal payments (no goods or services are exchanged), aimed at supporting low-income groups, boosting consumption, and reducing inequality.
D. Borrowing:
If government spending exceeds its revenue (deficit), it borrows from:
- Domestic financial markets (e.g., issuing bonds)
- Foreign lenders
This borrowing ensures that government expenditure continues, keeping the flow active even during revenue shortfalls.
4. Flows in the Circular Model
A. Real Flows (Physical Flows):
These are the tangible movements of resources and goods:
- Households provide labor, land, capital to firms
- Firms provide goods and services to households and the government
B. Money Flows (Financial Flows):
These are the monetary payments associated with real flows:
- Firms pay wages, rent, interest, profits to households
- Households spend income on goods and services
- Taxes flow to the government
- Government injects money through spending and transfers
Both flows move simultaneously and continuously, ensuring the economy remains active and dynamic.
5. Injections and Leakages
The model includes two important concepts—injections and leakages—which help understand the balance and growth of the economy.
A. Leakages (Withdrawals from the Flow):
Leakages are reductions in the spending cycle, which slow down economic activity. They include:
1. Taxes (T): Collected by the government
2. Savings (S): Income not spent on consumption, stored in banks
3. Imports (M): Money spent on foreign goods/services
Leakages represent money that is not immediately re-spent in the domestic economy.
B. Injections (Additions to the Flow):
Injections are additions to the spending cycle, boosting economic activity. They include:
1. Government Spending (G): On infrastructure, services, etc.
2. Investment (I): Firms invest in capital goods, research, expansion
3. Exports (X): Foreign spending on domestic goods and services.
Injections increase demand and help maintain or increase the income flow.
6. Circular Nature of the Economy
The beauty of the model lies in its cyclical nature:
- Income flows from firms to households (as wages, rent, etc.)
- Households spend on goods and services, which returns income to firms
- Taxes move to the government, which uses it to spend on goods and services or transfer money back to households
- This re-circulation of money maintains economic activity
A balance between injections and leakages ensures that the circular flow is stable. If injections exceed leakages, the economy expands (growth); if leakages exceed injections, the economy contracts (recession).
Summary Table: Roles in the Circular Flow
Actor | Provides | Receives | Interaction With Other Sectors |
Households | Factors of production | Factor income, transfers | Sell to firms; pay taxes; consume |
Firms | Goods and services | Revenue from sales, subsidies | Hire from households; sell to govt |
Government | Public services, transfers | Taxes, borrowing | Spends on firms; transfers to people |
3. Circular Flow of Income in a Four-Sector Economy
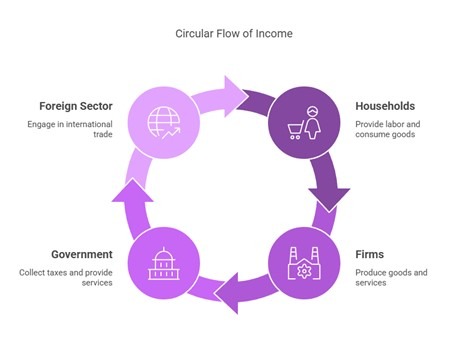
The four-sector model of the circular flow of income provides a more complete and realistic view of a modern open economy. It includes:
1. Households
2. Firms
3. Government
4. Foreign Sector
This model captures the internal economic interactions and also external trade through imports and exports. The continuous flow of goods, services, resources, and money keeps the economy functioning efficiently.
1. Households: Providers and Consumers
Households play a dual role in the economy. They are both resource suppliers and consumers.
Functions:
Provide Factors of Production:
- Households offer labor, land, capital, and entrepreneurial skills to firms in exchange for income.
Earn Factor Incomes:
- Wages (for labor)
- Rent (for land)
- Interest (for capital)
- Profits (for entrepreneurship)
Consumption Expenditure:
- Households use their income to purchase goods and services from firms.
Pay Taxes:
- Taxes are paid to the government out of their incomes (direct taxes) and through purchases (indirect taxes).
Save a Portion of Income:
- Income not spent is saved, usually through financial institutions. Savings represent a leakage from the flow of income.
2. Firms: Producers and Income Distributors
Firms are responsible for the production of goods and services using resources provided by households.
Functions:
Employ Factors of Production:
- Firms hire labor, rent land, borrow capital, and utilize entrepreneurship to produce goods and services.
Pay Factor Incomes:
- Wages, rent, interest, and profits are paid to households as compensation for resource use.
Produce and Sell Output:
- Firms sell their output to:
- Households (consumption goods)
- Government (public procurement)
- Foreign Sector (exports)
- Firms sell their output to:
Investment:
- Firms invest in machinery, infrastructure, and research, adding to the productive capacity of the economy (an injection).
Pay Taxes:
- Taxes on profits, production, and sales are paid to the government.
3. Government: Regulator and Redistributor
The government plays an active role in economic stabilization, income redistribution, and resource allocation.
Functions:
Tax Collection:
- Taxes are collected from:
- Households (e.g., income tax)
- Firms (e.g., corporate tax, excise duties)
- Taxes are collected from:
Government Spending:
- Revenue is used to provide public goods and services, such as infrastructure, education, health, and defense.
- This spending goes to:
- Firms (purchase of goods and services)
- Households (wages for public employees, pensions, welfare transfers)
Transfer Payments:
- Government makes non-reciprocal payments:
- Social security
- Unemployment benefits
- Subsidies to firms
- Government makes non-reciprocal payments:
Borrowing:
- When expenditures exceed revenues, the government borrows domestically or from international institutions, adding funds into the economic flow.
4. Foreign Sector: Trade and Global Linkages
The foreign sector connects the domestic economy to the rest of the world, enabling international trade and financial flows.
Functions:
Exports (X):
- Domestic firms sell goods and services abroad.
- Exports bring foreign money into the economy—an injection.
Imports (M):
- Domestic households, firms, or the government buy foreign goods and services.
- Imports involve spending money outside the domestic economy—a leakage.
Net Exports:
- The difference between exports and imports (X − M) affects the overall circular flow.
- If X > M → Net injection
- If M > X → Net leakage
- The difference between exports and imports (X − M) affects the overall circular flow.
5. Key Flows in the Four-Sector Model
A. Real Flows (Physical Movement):
- Factors of production: From households → firms
- Goods and services:
- From firms → households (consumption)
- From firms → government (public procurement)
- From firms → foreign buyers (exports)
B. Monetary Flows (Financial Movement):
- Income: From firms → households (factor payments)
- Consumption expenditure: From households → firms
- Taxes: From households and firms → government
- Government spending: From government → firms and households
- Investment: From firms → capital goods market
- Exports revenue: From foreign buyers → domestic firms
- Payment for imports: From domestic agents → foreign producers
6. Injections and Leakages
Understanding injections and leakages is essential for analyzing the equilibrium or disequilibrium in the economy.
A. Leakages (Withdrawals from the circular flow):
These reduce the flow of income and spending:
1. Savings (S): Income not spent by households
2. Taxes (T): Paid to the government
3. Imports (M): Money spent on foreign goods
B. Injections (Additions to the circular flow):
These boost economic activity:
1. Investment (I): Spending by firms on capital goods
2. Government Spending (G): Public expenditure on goods and services
3. Exports (X): Income from selling goods to foreign countries
Economic Equilibrium:
An economy is in equilibrium when:
Injections = Leakages
That is: I + G + X = S + T + M
If injections exceed leakages → economy expands (growth)
If leakages exceed injections → economy contracts (recession)
Summary Table of Sectoral Interactions
Sector | Provides | Receives | Role in Flow |
Households | Factors of production | Income, government transfers | Consume goods, pay taxes, save |
Firms | Goods and services | Revenue, subsidies | Produce, invest, pay wages, pay taxes |
Government | Public goods, services, transfers | Taxes, borrowed funds | Spends on public welfare and subsidies |
Foreign Sector | Imports | Export payments | Facilitates trade (exports/income, imports/leakage) |
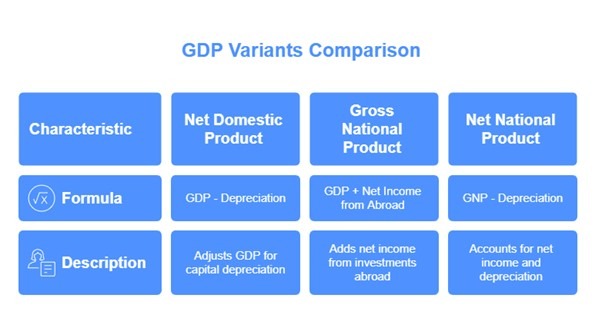
Variants of GDP:
Understanding the variants of GDP is crucial to comprehending national income measures:
Net Domestic Product (NDP):
Formula: NDP = GDP – Depreciation
It adjusts GDP by accounting for the depreciation of capital goods, which considers the wear and tear over time.
Gross National Product (GNP):
Formula: GNP = GDP + Net Income from Abroad
GNP adds net income earned by residents from investments abroad to GDP, reflecting the total economic output by residents.
Net National Product (NNP):
Formula: NNP = GNP – Depreciation
It accounts for both net income from abroad and the depreciation of capital, providing a clearer picture of the economy’s available resources.
1. Net Domestic Product (NDP)
Definition:
NDP is a measure of a nation’s economic output after accounting for depreciation of its capital assets. This measure is crucial because it provides a more accurate picture of the sustainable economic performance by indicating how much net output is available for consumption and investment.
Significance:
Understanding NDP helps policymakers and economists gauge the actual growth of an economy by factoring in the loss of value of capital goods. This adjustment is essential for long-term economic planning and assessing living standards over time.
NDP (Net Domestic Product):
NDP=GDP−Depreciation
- Example: Consider a country that produces various goods using machinery and equipment. If, at the end of a year, the economy generates a GDP of $1 trillion, but the machinery loses $200 billion in value over the same period (due to wear and tear), the NDP would be calculated as follows:
- [ NDP = GDP – {Depreciation} = 1 {trillion} – 200 {billion} = 800 {billion}] This $800 billion represents the net economic value generated after replacing depreciated capital, indicating resources available for investment or consumption.
2. Gross National Product (GNP)
Definition:
GNP measures the total economic output produced by the residents of a country regardless of their location—domestically or abroad. It captures the income earned by citizens on overseas investments and subtracts income earned by foreigners within the country.
Significance:
GNP is important for understanding a country’s overall economic performance and the global engagement of its citizens. It reflects the productive capacity and economic contributions of a nation’s residents, allowing for assessments of how much wealth is being created by the country’s citizens.
GNP (Gross National Product):
GNP=GDP+NFIA
- Example: If a country has a GDP of $1 trillion and its residents earn $200 billion from investments abroad while foreign residents earn $50 billion within the country, the GNP is determined as follows:
- [ GNP = GDP + {Net Factor Income from Abroad} = 1 {trillion} + (200 {billion} – 50 {billion}) = 1.15 {trillion}] This indicates that the economic contributions of the country’s citizens amount to $1.15 trillion globally.
3. Net National Product (NNP)
Definition:
NNP is the total economic output of a nation’s residents, adjusted for capital depreciation. This measure provides insight into the net economic productivity that can be sustained in the long term.
Significance:
NNP is crucial for assessing the welfare of current and future generations. It highlights whether an economy is sustainably utilizing its resources or depleting its capital stock.
Example:
Using the earlier GNP of $1.15 trillion, if annual depreciation is estimated to be $150 billion, then NNP is calculated as follows: [ NNP = GNP – {Depreciation} = 1.15 {trillion} – 150 {billion} = 1 {trillion}] This $1 trillion represents the real capacity for consumption and investment without diminishing capital assets over time.
4. National Disposable Income (NDI)
Definition:
NDI reflects the total income available to a nation for domestic consumption or savings after accounting for net transfers received from abroad. These transfers can include remittances or foreign aid.
Significance:
NDI is an essential indicator for understanding the economic well-being of a country’s residents. It provides insight into the amount of money available for spending and investment that can support economic growth and social welfare.
Example:
If the NNP is $1 trillion and the country receives $100 billion in foreign aid and remittances, NDI would be calculated as: [ NDI = NNP + {Other Current Transfers} = 1 {trillion} + 100 {billion} = 1.1 {trillion}] This amount of $1.1 trillion indicates the total financial resources available for households and governments to spend on goods and services.
1. Gross Domestic Product at Market Price (GDPMP)
Definition:
GDPMP represents the total market value of all finished goods and services produced within a country in a specific period, evaluated at prevailing market prices.
2. Gross Domestic Product at Factor Cost (GDPFC)
- Formula: [ {GDPFC} = {GDPMP} – {Indirect Taxes} + {Subsidies}]
- Definition: This measures the value of production based on the incomes earned by factors of production (labour and capital) before indirect taxes and after considering subsidies.
3. Net Domestic Product at Market Price (NDPMP)
- Formula: [{NDPMP} = {GDPMP} – {Depreciation}]
- Definition: NDPMP accounts for depreciation (the decrease in value of assets over time), providing a better insight into the net output of the economy.
4. Net Domestic Product at Factor Cost (NDPFC)
- Formula: [{NDPFC} = {NDPMP} – {Indirect Taxes} + {Subsidies}]
- Definition: This represents the net income available to factor owners, adjusted for taxes and subsidies.
5. Gross National Product at Market Price (GNPMP)
- Formula: [ {GNPMP} = {GDPMP} + {Net Factor Income from Abroad (NFIA)}]
- Definition: GNPMP includes all economic activities by residents of a country, regardless of where the activities take place. NFIA accounts for income earned by residents abroad minus income earned by foreigners in the domestic economy.
6. Gross National Product at Factor Cost (GNPFC)
- Formula: [ {GNPFC} = {GDPFC} + {NFIA}]
- Definition: Similar to GNPMP, but valued at factor cost. Adjustments for indirect taxes and subsidies are also applied here.
7. Net National Product at Market Price (NNPMP)
- Formula: [ {NNPMP} = {GNPMP} – {Depreciation}]
- Definition: NNPMP shows the net output based on national income after accounting for the reduction in the value of capital assets.
8. Net National Product at Factor Cost (NNPFC or National Income)
- Formula: [{NNPFC} = {NNPMP} – {Indirect Taxes} + {Subsidies}]
- Definition: NNPFC is considered equivalent to National Income and represents the actual income earned by the factors of production within the nation after accounting for depreciation and adjusting for taxes and subsidies.
Feature | GDP (Gross Domestic Product) | GNP (Gross National Product) | GNI (Gross National Income) |
Measurement | Total market value of final goods and services produced within a country’s borders. | Total market value of final goods and services produced by residents of a country, regardless of location. | Total income earned by residents of a country, including income earned from abroad. |
Focus | Production within a country’s borders. | Production by residents of a country. | Income received by residents of a country. |
Components | Consumption + Investment + Government Spending + Net Exports. | Consumption + Investment + Government Spending + Net Factor Income from Abroad. | GNI = GDP + Net Factor Income from Abroad. |
Uses | Measuring economic activity within a country. | Understanding the economic contribution of a country’s residents, regardless of where the production occurs. | Comparing the economic performance of different countries and assessing the overall income of residents. |
Limitations | Ignores income earned by foreign companies operating in the country. | Does not include income earned by residents abroad. | May not fully capture the well-being of all residents if significant income inequality exists. |
1. Private Income (PI)
Definition:
Private Income represents the total income received by the private sector, which includes individuals, businesses, and other private entities.
Components:
- Factor Income from Net Domestic Product: This includes wages, salaries, and profits earned by the private sector. It indicates the income generated through productive activities.
- National Debt Interest: This refers to the interest payments received by private entities from the government for national debt holdings.
- Net Factor Income from Abroad: It accounts for the difference between income earned by residents from overseas investments and income earned by foreigners in the domestic economy. A positive net income enhances total private income.
- Current Transfers from Government: These are transfers such as pensions, social security benefits, and scholarships that directly support households and contribute to their income.
- Other Net Transfers: This includes other forms of transfers from the rest of the world, excluding non-reciprocal gifts and foreign aid.
2. Personal Income (PI)
Definition:
Personal Income is derived from National Income and reflects the income attributed to households before taxation. It is crucial because it indicates the income available to individuals for consumption and saving.
Adjustment Components:
- Undistributed Profits: Profits retained by firms for reinvestment instead of being distributed to shareholders must be deducted from National Income as they do not directly benefit households.
- Corporate Tax: Since corporate taxes are not part of households’ income, they are subtracted from National Income to arrive at Personal Income.
- Net Interest Payments: While households earn interest on loans provided, they also incur interest on borrowed funds. Therefore, we calculate net interest payments (income received minus income paid) to determine the actual benefit to individuals.
- Transfer Payments: Positive contributions from government or firm transfers, like pensions and scholarships, need to be added back to NI to determine PI.
- Formula: [{Personal Income (PI)} = {National Income (NI)} – {Undistributed Profits (UP)} – {Net Interest Payments} – {Corporate Tax} + {Transfer Payments}]
3. Personal Disposable Income (PDI)
Definition:
PDI represents the income available to households for spending or saving after accounting for all mandatory payments.
Adjustment Components:
- Personal Tax Payments: This includes all taxes directly levied on individuals, such as income taxes, which reduce the disposable income available for personal use.
- Non-Tax Payments: Costs such as fees, fines, and other charges that are not classified as taxes but still represent a financial obligation for households.
- Formula: [{Personal Disposable Income (PDI)} = {Personal Income (PI)} – {Personal Tax Payments} – {Non-tax Payments}]
Overall Implications
Understanding these income concepts helps to analyze economic health and household financial capacity:
- Personal Incomeprovides a measure of total economic activity felt by individuals, while Personal Disposable Income reflects their real purchasing power after obligatory payments.
- Economic policies impacting taxes, government transfers, and corporate distributions will significantly affect both personal income and disposable income, influencing consumer behaviour and overall economic growth.
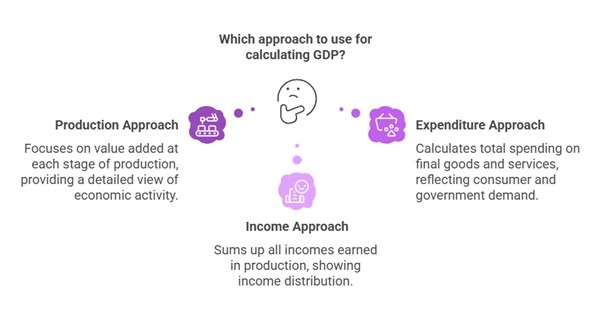
Methods of Calculating National Income (or GDP)
Production Approach: Summing up the value added at each stage of production.
Expenditure Approach: Calculating total spending on final goods and services.
Income Approach: Summing up all incomes earned in the production of goods and services.
Production or Value-Added Method
One of the primary approaches for calculating national income is the Production or Value-Added Method. This method is also referred to as the Output Method or Value-Added Method, and it focuses on quantifying the economic contributions of different sectors within the economy.
Key Features of the Production or Value-Added Method:
- Estimation of National Income: The value-added method estimates national income by assessing the incremental value that is added at each stage of production within various economic sectors. This involves analyzing how much value each sector contributes to the overall economy.
- Difference Measurement: This method calculates the difference between the total value of goods and services produced (known as the output) and the value of goods and services utilized in the production process (referred to as intermediate consumption). By doing this, it provides a clearer and more accurate depiction of an economy’s productive capacity.
- Comprehensive Picture: The value-added approach offers a holistic view of economic production, as it accounts for the varying contributions made by different sectors—such as agriculture, manufacturing, and services—at each stage of production.
- Step-by-Step Calculation: The calculation involves subtracting intermediate consumption from the total output value at each stage of production in different sectors. This allows for a granular analysis of how value accumulates in the production chain.
- Application Across Sectors: This method is widely used for estimating GDP, as it effectively highlights the sector-wise contributions to overall economic output. It can clearly illustrate the performance of various industries and their impact on the national economy.
- Understanding Intermediate Consumption: It is essential to note that intermediate consumption refers to the inputs or raw materials used to create final goods. These inputs are subtracted while computing Gross Value Added (GVA) to avoid double-counting the value of a product—once as a finished product and again in the form of raw materials used in production.
Formula Representation
The formula to calculate Gross Value Added (or GDP at Market Prices) can be expressed as: [{(GVA or GDP) MP} = {Value of Output of all Sectors} – {Intermediate Consumption of all Sectors}]
Expenditure Method (Final Expenditure Approach)
One of the key approaches for calculating national income is the Expenditure Method, also known as the Final Expenditure Method. This approach focuses on assessing the total spending on final goods and services within an economy over a specific period. It measures the demand side of economic activity and is commonly used in macroeconomic analysis.
Key Features of the Expenditure Method:
- Estimation of National Income: The Expenditure Method estimates national income by calculating the aggregate expenditure incurred by various sectors—households, businesses, government, and foreign entities—on final goods and services produced within the country.
- Component-Based Calculation: This method relies on the sum of four key components: Consumption (C), Investment (I), Government Expenditure (G), and Net Exports (X – M). Each component reflects a distinct type of economic activity, contributing to a comprehensive estimate of total output.
- Exclusion of Intermediate Goods: To avoid double counting, the method includes only final goods and services in the calculation. Intermediate goods, which are used in the production of other goods, are excluded since their value is already embedded in the price of final goods.
- Sectoral Contributions via Spending: While not directly showing sectoral output like the production method, the expenditure approach implicitly reflects the performance of sectors based on demand patterns—for example, high consumer spending indicates a strong retail/services sector.
- Reflects Aggregate Demand: This method gives insight into the overall aggregate demand in the economy, helping policymakers understand inflationary trends, investment cycles, and consumption behavior.
- Calculation Formula: GDP=C+I+G+(X−M)
Where:
- C = Private Final Consumption Expenditure
- I = Gross Capital Formation (investment)
- G = Government Final Consumption Expenditure
- X = Exports of goods and services
- M = Imports of goods and services
Income Method (Factor Income Approach)
Another essential approach for computing national income is the Income Method, also called the Factor Income Approach. This method emphasizes the earnings of factors of production—land, labor, capital, and entrepreneurship—within the domestic economy.
Key Features of the Income Method:
- Estimation of National Income: The Income Method estimates national income by summing up all incomes earned by individuals and institutions involved in the production of goods and services. These include wages, rents, interests, profits, and mixed incomes.
- Focus on Factor Earnings: The approach highlights how income is distributed among the owners of various factors of production:
- Wages and salaries for labor
- Rent for landowners
- Interest for capital providers
- Profits for entrepreneurs
- Mixed Income for self-employed individuals (who supply multiple factors)
- Inclusion of Net Indirect Taxes: To arrive at GDP at market prices, Net Indirect Taxes (Indirect Taxes – Subsidies) are added to factor incomes. This ensures alignment with other GDP approaches.
- Captures Distributional Aspects: This method provides a clearer picture of income distribution in the economy and is especially useful for analyzing wage trends, business earnings, and overall economic welfare.
- Exclusion of Transfer Payments: Transfer payments like pensions, unemployment benefits, and subsidies are excluded, as they do not reflect current production.
- Calculation Formula:
National Income=Compensation of Employees+Rent+Interest+Profits+Mixed Income
National Income} = {Compensation of Employees} + {Rent} + {Interest} + {Profits} + {Mixed Income}
National Income=Compensation of Employees+Rent+Interest+Profits+Mixed Income
To get GDP at market prices:
GDP (mp) =National Income + Net Indirect Taxes + Depreciation
{GDP}{{mp}} = {National Income} + {Net Indirect Taxes} + {Depreciation}
Feature | GVA (Gross Value Added) | GDP (Gross Domestic Product) |
Definition | Measures the value added by each sector (agriculture, industry, services) at each stage of production. | Measures the total market value of all final goods and services produced in a country within a specific period. |
Formula | GVA = GDP – Net Factor Income (Income paid abroad – Income received from abroad) | GDP = GVA + Net Taxes (Taxes earned – Subsidies provided) |
Focus | Provides a granular view of sectoral contributions to the economy. | Provides a broader view of overall economic performance. |
Significance | Helps identify areas for sector-specific growth and assess sectoral performance. | Used for international comparisons and measuring overall economic health. |
Use Cases | Policymakers use GVA to target interventions and track sectoral progress. | Investors and analysts use GDP to assess market potential and compare economies. |
India’s Growth (2024 Q2) | 7.4% growth | 7.6% growth |