
Climate Change – Causes, Impacts & Mitigation:
- Climate change denotes the long-term alterations in temperature and weather patterns, including rainfall, snow, and wind, which are directly or indirectly linked to human activities that modify the atmospheric composition, resulting in natural climate variability observed over extensive timeframes, typically hundreds of years.
- While some climate change phenomena may occur naturally, such as fluctuations in the solar cycle, the combustion of fossil fuels like coal, oil, and gas, along with deforestation since the 1800s, has significantly contributed to greenhouse gas emissions.
- These emissions create a greenhouse effect, akin to a blanket enveloping the Earth, which traps solar heat and leads to an increase in global temperatures, a phenomenon known as global warming. Global warming represents a long-term increase in the Earth’s temperatures and is merely one facet of climate change.
- The term ‘climate change’ encompasses global warming but also refers to a wider array of alterations, including rising sea levels, the reduction of mountain glaciers, the accelerated melting of the cryosphere, and ocean acidification.
- Throughout its geological history, the Earth has undergone episodic climate change events characterized by both global warming and cooling phases, such as glaciation. Notably, global temperatures have shown a significant upward trend since the early 20th century, particularly pronounced since the late 1970s.
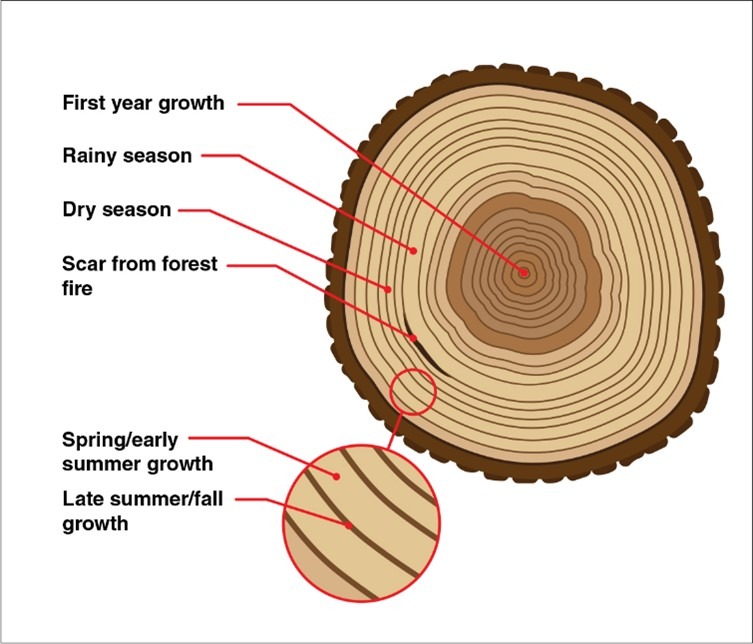
How can we gain insights into historical climate change events?
- Tree rings serve as a record of the Earth’s climatic conditions over centuries or even millennia.
- Each ring in a tree indicates its age and reflects the climatic conditions experienced during each year of its growth.
- A single light ring paired with a dark ring signifies one year in the tree’s lifespan, with the light rings corresponding to growth in early summer and the dark rings to late summer growth.
- The variations in color and width of these rings offer valuable information about past climate conditions; for instance, tree rings tend to be wider in years of abundant rainfall and narrower during periods of drought.
Ice cores from the cryosphere:
- Ice cores, which are cylindrical samples of ice, are obtained through deep drilling into glaciers and ice sheets. These cores provide valuable insights into the climatic conditions of our planet from millennia past.
- Polar ice sheets and glaciers are created over extensive periods through the accumulation of snowfall. Each distinct layer of ice encapsulates a narrative of the Earth’s conditions at the time the corresponding snow fell.
- These frozen strata contain trapped air molecules, greenhouse gases, and aerosols, including dust, ash, pollen, and sea salts from that era. Such particulates serve as historical records of significant global occurrences, including climate fluctuations and substantial volcanic eruptions.
Greenhouse Effect:
- The greenhouse effect refers to a phenomenon occurring within a structure, primarily constructed of transparent materials like glass, designed to cultivate plants that thrive under controlled climatic conditions.
- In such a structure, solar radiation, including visible light and parts of the infrared and ultraviolet spectrum, penetrates the glass surfaces.
- This radiation is absorbed by the ground and the contents within, leading to an increase in temperature as they emit energy in the form of longer-wavelength infrared radiation.
- Since the materials used for the walls of the greenhouse do not allow infrared radiation to pass through, this heat cannot escape through radiative transfer.
- Additionally, the enclosed nature of the greenhouse prevents heat loss through convection, resulting in a rise in internal temperature, a phenomenon commonly referred to as the greenhouse effect.
Importance of Natural Greenhouse Effect:
- The significance of the natural greenhouse effect is profound, as it has been a fundamental process on Earth for millions of years.
- This effect, primarily driven by water vapor and minute water particles in the atmosphere, accounts for over 95 percent of the total greenhouse warming, thereby enabling the sustenance of life on our planet.
- Furthermore, the natural greenhouse effect helps maintain average global temperatures at approximately 15°C; in its absence, these temperatures could plummet to around -17°C, rendering the existence of life impossible.
Carbon Footprint:
The carbon footprint quantifies the environmental impact of activities by measuring the CO2 emissions generated from fossil fuel combustion, expressed in tons. This metric is assessed annually and can pertain to individuals, organizations, or products. India has committed to reducing the emissions intensity of its economy by 33-35% by the year 2030, relative to the levels recorded in 2005.
Carbon Footprint of various Sectors:
The World Resources Institute (WRI) categorizes total global emissions from 2005 into several key sectors:
1. Energy
- Electricity and heat (24.9%)
- Industry (14.7%)
- Transportation (14.3%)
- Other fuel combustion (8.6%)
- Fugitive emissions (4%)
2. Agriculture (13.8%)
3. Land use change (12.2%)
4. Industrial processes (4.3%)
5. Waste (3.2%).
Carbon Bombs:
- A Carbon Bomb refers to a coal, oil, or fossil gas project that has the capacity to release over one Gigaton of CO2 emissions throughout its operational lifespan.
- The Leave It In the Ground Initiative (LINGO) has identified a total of 425 such projects globally.
- LINGO asserts that the potential emissions from these Carbon Bombs surpass the 1.5°C carbon budget by a factor of two.
- The countries with the highest concentration of Carbon Bombs include China, the United States, Russia, and Saudi Arabia.
- Notable examples of identified Carbon Bomb projects are the Carmichael Coal Project, a coal mine located in Queensland, Australia, owned by the Adani Group; the Gevra Coal Mines in Chhattisgarh operated by Coal India; and the Rajmahal Coal Mines situated in eastern Jharkhand, which is owned by Eastern Coalfields.
The Leave It In the Ground Initiative (LINGO) is a research organization dedicated to the principle of refraining from fossil fuel extraction and promoting sustainable living practices. It envisions a future entirely reliant on renewable energy sources and supports the implementation of a circular economy. LINGO seeks to mobilize grassroots support to oppose fossil fuel projects and to contest them through legal means.
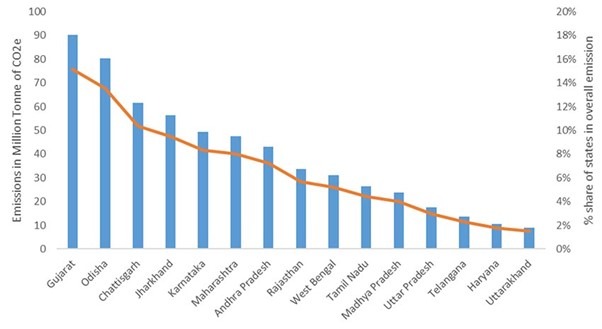
State Wise Carbon Emissions in India:
- The primary sources of carbon dioxide emissions are Maharashtra, West Bengal, and Gujarat. Between 2010 and 2015, electricity generation accounted for 35.5% of total CO2 emissions.
- In terms of road transport, Maharashtra has the highest annual emissions, followed by Gujarat and Uttar Pradesh.
- The cement and steel industries are significant contributors to industrial CO2 emissions, with Rajasthan, Andhra Pradesh, Tamil Nadu, and Madhya Pradesh being the leading cement producers, responsible for 57% of India’s output.
- The steel industry is primarily located in Chhattisgarh, Jharkhand, Maharashtra, and Gujarat.
- In agriculture, methane emissions from biomass are most prevalent in Uttar Pradesh, Punjab, West Bengal, Madhya Pradesh, and Andhra Pradesh.
Impact of Global Warming:
Increased Frequency and Severity of Heat Waves:
The extraordinary heatwave of 2021, which resulted in the loss of hundreds of lives in British Columbia (South-Western Canada) and the adjacent states of Washington and Oregon (North-Eastern US), represents the most recent occurrence in an increasing series of severe weather phenomena linked to global warming. Recent deadly wildfires in Australia (2019-20), California (2020), and Siberia have also been attributed to such extreme heat conditions.
Heat Wave:
A heat wave refers to an extended duration of unusually high temperatures.
- The India Meteorological Department (IMD) officially designates a heat wave when the observed maximum temperature reaches 45°C or higher, irrespective of the typical maximum temperature.
- Heat waves can result from the displacement of Jet Streams (meandering Rossby Waves in temperate regions leading to Heat Domes, as detailed in Physical Geography > Page 236), local hot winds such as loo (which impact the Gangetic Plains Region), and human-induced factors like global warming.
Global Warming and Heat Waves:
- Since 1900, the global average temperature has risen by approximately 1.3°C, while in India, it has exceeded 2°C. As emissions persist in increasing, India is likely to experience more frequent heat waves compared to other regions of the world.
- Research conducted by the Indian Meteorological Department and the Indian Institute of Tropical Meteorology in Pune indicates a notable rise in both the frequency and intensity of heatwaves in India over the past thirty years.
- The repercussions of these heatwaves extend beyond urban areas, although cities exacerbate the situation through the creation of Urban Heat Islands.
Effects of Heat Waves:
- Heat-related illnesses, such as sunstroke (characterized by body temperatures exceeding 40°C), can lead to vital organ failure.
- In 2015, heat waves in India were responsible for over 2,300 fatalities. Similarly, a record heat wave in July 2021 resulted in the deaths of more than 500 individuals in western Canada.
- Additionally, heat waves adversely affect human productivity, particularly mental health, as optimal body functioning occurs within a narrow temperature range of 36-37.5°C.
- The economic implications are significant, as there is an increased reliance on cooling devices, which inadvertently contributes to a positive feedback loop that exacerbates global warming: heat waves necessitate more cooling appliances, leading to higher emissions and consequently more severe heat waves.
- Furthermore, ecological repercussions include diminished biological activity and reduced carbon sequestration.
- One of the most severe outcomes of heat waves in temperate regions is the occurrence of wildfires, as evidenced by the Australian bushfires of 2019-2020 and the wildfires in western Canada in July 2021.
Urban Heat Islands:
An urban heat island refers to a metropolitan or industrial region that experiences significantly elevated temperatures compared to its adjacent rural areas, despite both regions having the same climatic conditions, primarily as a result of human activities.
Causes Behind Urban Heat Islands:
- The replacement of natural vegetation and water bodies with heat-retaining materials such as concrete and asphalt, which possess low albedo, leads to diminished evaporation and evapotranspiration.
- Additionally, the prevalence of high-rise buildings increases the surface area available for heat absorption.
- The density of vehicles contributes to elevated heat emissions from their engines, while high levels of pollution and greenhouse gases, particularly CO2 from thermal power plants and vehicles, exacerbate the situation.
- Greenhouse gases, aerosols, and particulate matter effectively absorb outgoing infrared radiation.
- Furthermore, cooling devices like air conditioners expel heat into the environment.
- The occurrence of poor monsoons can be attributed to reduced water evaporation from both vegetation and soil.
- Urban areas experience heat retention at night, a phenomenon that was not as pronounced in the past, primarily due to the influence of air conditioning, pollution, and the close proximity of dense building networks, which contribute to the formation of urban heat islands after sunset.
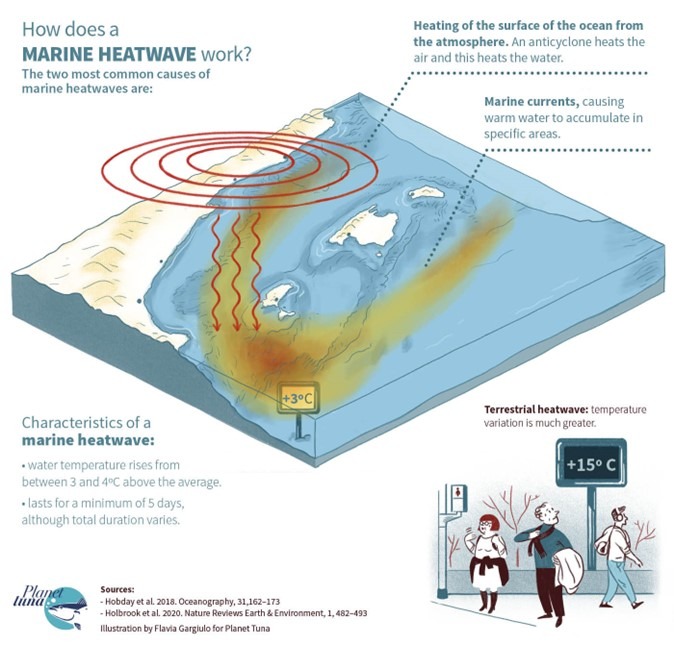
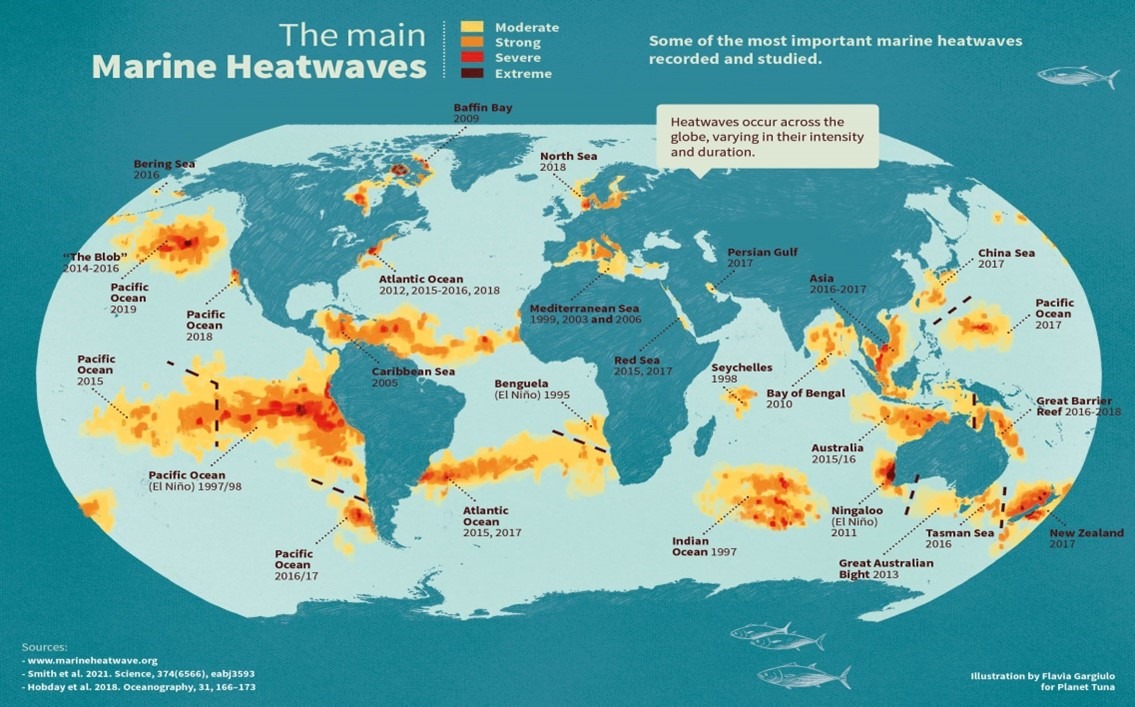
Marine Heat Waves:
Marine heatwaves are defined as prolonged periods during which ocean temperatures at specific locations rise to unusually high levels, significantly affecting marine ecosystems and global weather patterns, regardless of the season.
IPCC Special Report on the Ocean and Cryosphere in a Changing Climate (SROCC) on Marine
Heat Waves:
- The current state of the oceans is marked by extraordinary phenomena, including rising temperatures, heightened ocean acidification, marine heatwaves, and an increase in the frequency of extreme El Niño and La Niña occurrences.
- Coastal communities, small island nations, polar regions, and high-altitude areas are especially susceptible to these changes, facing challenges such as rising sea levels and diminishing glaciers.
- Additionally, communities in various regions are impacted by severe weather events intensified by the warming of the oceans.
Marine heat waves:
Over the past forty years, marine heat waves have increased in frequency, occurring twice as often and persisting for longer durations. The report indicates that human activities account for 84 to 90 percent of the marine heat waves observed in the last ten years. Projections suggest that by the year 2081, the occurrence of marine heat waves may escalate by a factor of 20 to 50.
Impact on marine productivity:
- Marine heat waves have led to extensive coral bleaching, a process from which corals require over 15 years to recuperate.
- These heat waves diminish the mixing of water layers, thereby reducing the availability of oxygen and nutrients essential for marine ecosystems.
- In the Pacific Ocean, where water temperatures have been abnormally high, there has been an increase in the proliferation of toxin-producing algae, while simultaneously hindering the development of smaller organisms that are crucial to the oceanic food web.
Impact on weather patterns:
- The primary factor contributing to marine heat waves is the presence of weak winds. These heat waves could significantly impact global wind patterns and oceanic currents.
- According to the IPCC report, the Atlantic Meridional Overturning Circulation (AMOC), which is responsible for the northward movement of warm, saline water in the upper Atlantic and the southward flow of colder, deeper waters, has already experienced a decline in strength.
A notable reduction in the AMOC could lead to:
- a further decline in productivity in the North Atlantic,
- an increase in storm activity in Northern Europe,
- diminished summer rainfall in the Sahel region of the Sahara Desert and South Asia,
- a decrease in the frequency of tropical cyclones in the Atlantic, and
- a rise in regional sea levels along the northeastern coast of North America, as highlighted in the report.
More severe cyclonic storms:
The Intergovernmental Panel on Climate Change (IPCC) indicates that there is growing evidence of a yearly rise in the proportion of category 4 and 5 storms, which maintain their intensity by drawing energy from the moisture present in warm ocean waters.
Increased Incidence of Wildfires:
The rising frequency of wildfires contributes to a self-reinforcing cycle that intensifies global warming.
Australia’s Bushfires are Getting Severe:
- Australia, which experiences the onset of summer around October, is recognized as the most fire-prone continent globally.
- This is primarily attributed to its status as the driest inhabited continent, with nearly 70% of its land classified as arid or semi-arid, receiving an average annual precipitation of less than 35 cm.
- The majority of Australia’s forested areas are located in the northern and eastern regions, where bushfires are a common occurrence each summer.
- However, recent years have seen an escalation in the severity of these fires, largely driven by climate change.
- In 2020, Australia faced its most severe drought and heat waves in over fifty years, leading to catastrophic wildfires that had a devastating impact on wildlife, resulting in the deaths of thousands of koalas.
Criticism of Australia’s climate policy:
Approximately one-third of the world’s coal exports originate from Australia, which is responsible for 7% of global carbon emissions. The nation stands as the foremost exporter of coal and liquefied natural gas globally. The Australian government has staunchly supported its coal sector in the face of opposition from environmental advocates. Furthermore, Australia has faced scrutiny for its approach of counting carbon credits under the Kyoto Protocol rather than implementing new measures to achieve its emissions reduction goals.
Wildfires and Zombie Fires Have Reached the Tundra:
- Wildfires in the permafrost regions of Siberia, located south of the Arctic, are relatively common occurrences.
- However, in 2020, fire activity was observed significantly north of the Arctic Circle in the tundra, an area typically not associated with extensive wildfires.
- This anomaly can be attributed to the unprecedented desiccation of tundra flora, including mosses, grasses, and dwarf shrubs.
- Furthermore, the phenomenon of ‘zombie fires’ is increasingly prevalent in the formerly frozen tundra regions north of the Arctic Circle.
- A zombie fire, also referred to as a holdover fire, is characterized by its ability to smolder beneath the surface, consuming carbon-rich peat without producing visible flames, often lingering from a previous growing season.
Concerns:
- The occurrence of wildfires and unprecedented high temperatures may transform the carbon sink into a carbon emitter.
Shrinking Cryosphere:
- The cryosphere encompasses regions of snow and ice that experience temperatures below 0°C for a portion of the year.
- This includes continental ice sheets located in Greenland and Antarctica, ice caps, glaciers, snowy regions such as the Alps and Himalayas, permafrost found in Siberia, as well as frozen sections of oceans, rivers, and lakes.
- Furthermore, an IUCN study indicates that glaciers in nearly half of the natural World Heritage sites, including the Khumbu Glacier in the Himalayas, are at risk of complete disappearance by the year 2100 if current emission levels persist.
- The research forecasts the extinction of glaciers in 21 out of the 46 natural World Heritage sites that contain glaciers.
Role of Cryosphere:
- Snow and ice exhibit the highest albedo, reflecting solar heat and influencing the heat budget.
- Glaciers and elevated snow-capped mountains provide essential freshwater resources to various regions globally.
- The cryosphere is particularly responsive to climatic variations, functioning as the Earth’s historical record, as layers of ice accumulate over time.
- Analyzing the vertical ice column is crucial for comprehending historical global climate changes.
Consequences of Shrinking Cryosphere (Glaciers):
- The increasing scarcity of water resources has led to conflicts between nations, while the degradation of ecologically significant coastal wetlands poses a serious threat to biodiversity.
- Additionally, the submergence of major coastal cities has resulted in distress migration among local populations, particularly affecting Small Island Developing States that are among the first to experience the adverse effects of climate change.
- Furthermore, significant alterations in weather patterns are anticipated, and the salinization of groundwater in coastal areas will exacerbate the situation.
- The irregular melting of glaciers is expected to diminish hydroelectric power generation, thereby heightening reliance on fossil fuels.
- Lastly, the ongoing loss of habitats is contributing to the alarming decline of animal populations, pushing numerous species closer to the brink of extinction.
Vegetation Change:
- The thawing of snow is expected to lead to an increase in arable land in high-latitude regions due to the decrease in frozen terrain.
- Conversely, coastal arable land is anticipated to diminish as a consequence of rising sea levels and the inundation of saline waters.
- Additionally, the transformation of tundra into swamps will result in a reduction of forested areas, thereby diminishing carbon sinks, while the thawing of permafrost will expose subsurface carbon reserves.
Surge-Type Glaciers and Disasters:
Surge-type glaciers are characterized by their notable increase in both volume and length over time, which contrasts sharply with the prevailing trend of significant shrinkage observed in the majority of glaciers. Unlike their more stable counterparts, surging glaciers experience irregular flow patterns, marked by cyclical instabilities that prevent a steady movement. The dynamics of these glaciers pose a considerable risk, as they can lead to devastating glacial lake outburst floods, particularly in the context of climate change and global warming, which can trigger their sudden collapse.
New Sea Routes in The Arctic region:
The Arctic Region is experiencing a rate of warming that is twice that of the global average. As a result of the melting ice, the Northern Sea Route (NSR), which links the North Atlantic to the North Pacific via a shorter polar arc, is gradually becoming more navigable. Projections indicate that this route may be entirely free of ice during the summer months by the year 2050.
New shipping routes:
- The emergence of the Arctic region offers significant commercial and economic prospects, especially in sectors such as shipping, energy, fisheries, and mineral extraction.
- Notably, the potential for commercial navigation via the Northern Sea Route (NSR) is particularly appealing, as it could reduce the travel distance from Rotterdam to Yokohama by 40 percent in comparison to the traditional Suez Canal route.
Access to unexploited resources:
It is estimated that unexplored oil and natural gas reserves constitute 22% of the world’s untapped resources, predominantly located in the Arctic Ocean, particularly in the Barents Sea region. Additionally, Greenland is home to significant mineral deposits, containing approximately 25% of the global reserves of rare earth elements.
Challenges associated with the new opportunities:
- The processes of mining and deep-sea drilling entail significant financial expenditures and pose considerable environmental hazards.
- In contrast to Antarctica, the Arctic does not function as a global commons; it lacks a comprehensive treaty framework. Instead, the United Nations Convention on the Law of the Sea (UNCLOS) provides the primary legal structure governing the region.
- A substantial portion of the Arctic is under the jurisdiction of the five coastal nations—Russia, Canada, Norway, Denmark (Greenland), and the United States—allowing them to exploit newly discovered resources, which may lead to renewed territorial disputes.
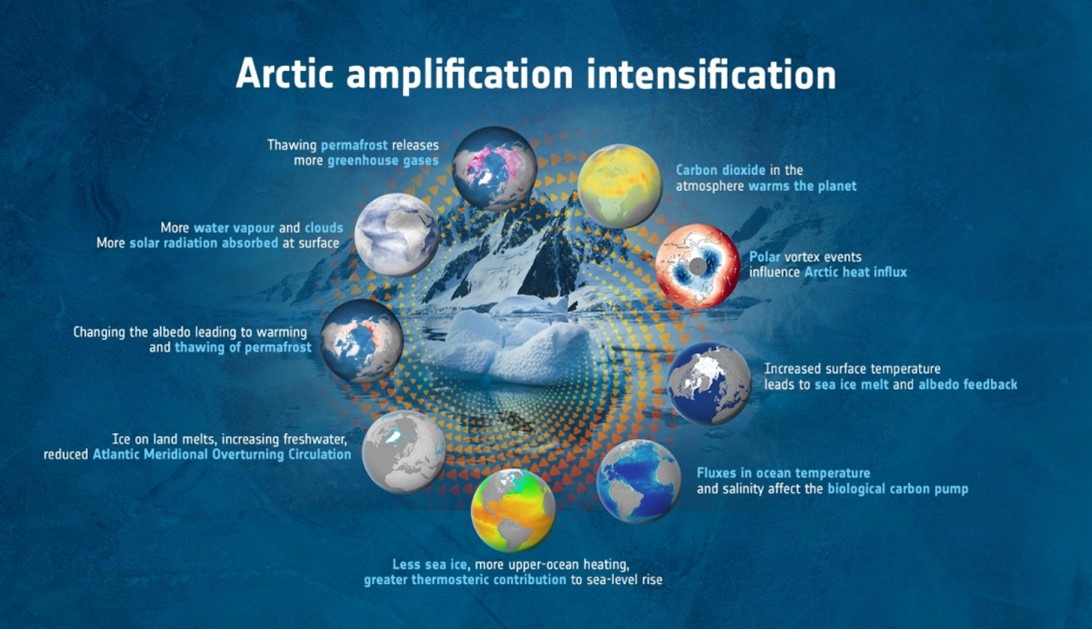
Arctic (or polar) Amplification (PA):
- The phenomenon known as Arctic Amplification refers to the disparity in warming rates between the polar regions and the tropics.
- This indicates that the Arctic is experiencing a more rapid increase in temperature compared to other global regions. Specifically, from 1971 to 2019, the average annual temperature in the Arctic rose by 3.1 degrees Celsius, in stark contrast to the global average increase of only 1 degree Celsius.
- Arctic Amplification occurs as a result of alterations in the Net Radiation Balance, which is marginally elevated in the Arctic compared to tropical regions.
- The Net Radiation Balance represents the equilibrium between incoming solar energy and outgoing energy at the uppermost layer of the atmosphere.
The accelerated warming of the Arctic can be attributed to several interrelated factors.
- One significant contributor is the change in albedo, which is primarily driven by the melting of polar ice at an alarming rate of 13% per decade.
- Ice possesses a high albedo, reflecting a substantial amount of sunlight, whereas the land and ocean exhibit lower albedo values.
- As the ice diminishes, it exposes darker surfaces that absorb more sunlight, leading to increased warming.
- Additionally, the melting sea ice facilitates the release of greenhouse gases from thawing permafrost and frozen methane deposits on the ocean floor, further exacerbating the warming phenomenon.
- Furthermore, the Arctic experiences a more pronounced amplification of warming compared to Antarctica due to its unique geographical characteristics; the Arctic is an oceanic region covered by seasonal sea ice, while Antarctica is a landmass with a more stable ice cover.
- Notably, the Antarctic continent has not experienced significant warming over the past seventy years, despite rising greenhouse gas concentrations in the atmosphere.
- The ramifications of Arctic warming are profound, with the most immediate consequence being global sea-level rise.
- The thawing of Arctic permafrost poses serious risks to the global climate system, as it releases substantial amounts of carbon dioxide and methane, which can trigger further warming through positive feedback mechanisms.
- The implications of Arctic amplification extend beyond the polar regions, significantly influencing mid-latitude climates and increasing the frequency of extreme weather events.
- This influence manifests through the weakening of the tropospheric jet stream, which can lead to unusual and severe weather patterns, as well as the destabilization of the stratospheric polar vortex, resulting in further extreme weather occurrences in mid-latitude regions.
Warming Arctic Ocean Increasing Snowfall in Siberia:
The warming of the Arctic Ocean has led to an increase in the rate of evaporation, resulting in a greater amount of moisture being present in the Arctic atmosphere. This heightened moisture subsequently travels towards northern Eurasia, contributing to a rise in snowfall, especially in the region of Siberia.
Sea Level Change:
Changes in sea level refer to the variations in the average sea level that occur over extended periods. Typically, seasonal fluctuations of approximately 5 to 6 centimeters are recorded annually.
Processes that cause Change in Sea Level:
- Eustatic changes refer to alterations in sea level that arise from variations in the volume of ocean water, which can be influenced by phenomena such as global warming leading to the melting of ice sheets, resulting in a rise in sea level, or the occurrence of ice ages that cause a decrease in sea level.
- Additionally, the volume changes in mid-oceanic ridges also contribute to these eustatic fluctuations.
- Tectonic changes, on the other hand, are associated with shifts in land elevation. Isostatic changes occur when there is a gain or loss of weight on the Earth’s crust; for instance, during ice ages, the weight of glacial ice causes land to sink, whereas the removal of this ice leads to the uplift of landmasses.
- Furthermore, epeirogenic movements involve large-scale tilting of continents, which can result in one section of a continent rising while another sinks, creating an illusion of rising sea levels.
- Lastly, orogenic movements, which are responsible for mountain formation, can lead to the development of high mountain ranges and an apparent decrease in sea level.
Short-term sea level change:
- The density of marine water is influenced by both temperature and salinity, with lower temperatures and higher salinity levels resulting in increased seawater density and consequently a reduction in sea level.
- Additionally, atmospheric pressure plays a significant role, as lower pressure conditions can lead to elevated local sea levels, exemplified by phenomena such as storm surges.
- Furthermore, the velocity of ocean currents affects sea level; for instance, fast-moving currents that follow a curved trajectory can create a notable rise in sea level along their outer edges, with observed differences reaching up to 18 centimeters along the current’s axis.
- Moreover, the formation of ice during winter months contributes to a decrease in sea level, as ocean water becomes trapped in the ice caps of both the northern and southern hemispheres.
- Lastly, the accumulation of water along windward coasts results in localized increases in sea level, particularly evident in regions such as South and East Asia during the monsoon season, when air masses drive water towards the coast.
Long-Term sea level change:
- Over the past century, human-induced global warming has led to the thermal expansion of ocean waters, resulting in a sea level increase of approximately 10 to 15 centimeters.
- Additionally, the melting of Antarctic ice sheets, which has accounted for about 3 percent of their total ice volume, has further contributed to the rise in global sea levels.
- It is important to note that significant alterations in global sea levels, potentially exceeding 100 meters, would only occur if the major ice sheets were to completely melt or if there were considerable changes in the volume of the world’s mid-oceanic ridges.
Significance of Understanding Sea Level Changes:
- This research offers crucial insights into historical climate variations, facilitates the estimation of tectonic uplift rates during previous geological epochs, and evaluates the viability of coastal regions for industrial and agricultural initiatives.
- Furthermore, it plays a significant role in safeguarding low-lying nations through the construction of coastal dykes and embankments.
- The mapping of regions susceptible to storm surges and recurrent flooding is rendered feasible, and by pinpointing areas that may face submersion in the foreseeable future, it enables the strategic establishment of tidal power generation facilities in appropriate sites.
Sea Level Rise and Coastal Flooding:
- The IPCC report indicates that if greenhouse gas emissions continue to rise significantly, sea levels may increase by 60 to 110 centimeters.
- This poses a serious threat to urban populations, as over half of the world’s inhabitants reside in cities, many of which are situated on low-lying coastal areas and islands.
- The economic repercussions of extreme flooding are projected to escalate dramatically, with losses expected to increase by 166 times by the year 2050.
- Current estimates reveal that approximately 300 million individuals, rather than the previously estimated 80 million, are living in regions that fall below the annual coastal flood line.
- A significant majority, nearly 80 percent, of these individuals are located in countries such as China, Bangladesh, India, Vietnam, Indonesia, and Thailand, with China alone accounting for 43 million people.
- Major cities, including Bangkok, Hong Kong, Shanghai, Taizhou, Surabaya, Dhaka, Mumbai, Ho Chi Minh City, and Osaka, will see millions of residents at risk of flooding as they find themselves within designated flood zones.
Vulnerable Areas in India:
- By the year 2050, approximately 36 million individuals residing along the coastlines of India will inhabit areas that are projected to be submerged below the annual flood level, thereby increasing their vulnerability to flooding.
- Cities such as Bhuj, Jamnagar, Porbandar, Surat, Bharuch, and Mumbai are particularly at risk due to rising sea levels.
- Additionally, the eastern coastline, especially in West Bengal and Odisha, faces significant threats from these environmental changes.
Small Island Developing States are the Biggest Losers:
- Small Island Developing States (SIDS) refer to a category of islands that are geographically isolated, face significant environmental threats, particularly from climate change, and are typically characterized by their small land area.
- This group was officially acknowledged as a unique subset of developing nations during the United Nations Conference on Environment and Development held in June 1992, commonly known as the 1992 Earth Summit.
- The majority of these islands are composed of coral and are situated on shallow atolls, rendering them particularly susceptible to the impacts of rising sea levels.
Barbados Programme of Action (1994):
The United Nations Programme of Action for the Sustainable Development of Small Island Developing States, commonly known as the Barbados Programme of Action (BPOA), serves as a pivotal policy framework that tackles the economic, environmental, and social challenges encountered by these islands, while proposing a comprehensive strategy aimed at alleviating such vulnerabilities. This programme stands as the sole internationally recognized initiative tailored specifically for Small Island Developing States (SIDS).
Mauritius Strategy (2005):
- The Mauritius Strategy and the Review of the Barbados Programme of Action (BPOA): The Mauritius Strategy was established as a result of a decade-long thorough evaluation of the BPOA, with the objective of enhancing its execution.
- The Marshall Islands and Nuclear Powers (2016): In 2016, the Marshall Islands initiated legal proceedings against India, Pakistan, and the United Kingdom in the International Court of Justice, alleging their negligence in addressing the nuclear arms proliferation.
- Addressing Sea Level Rise and Risk Assessment (1987): In response to the challenges posed by rising sea levels, the Oceans and Coastal Areas Programme Activity Centre was founded in 1987 under the auspices of the United Nations Environment Programme (UNEP), with a focus on identifying countries that are particularly vulnerable to the threat of submersion.
Regional Sea Level Rise (SLR):
Worldwide, 68% of areas are susceptible to coastal flooding, with more than 32% of this vulnerability linked to regional sea level rise (SLR). It is important to note that SLR is not consistent globally; for example, the gravitational influence of polar ice sheets results in varying impacts on sea levels in different regions, leading to instances where regional SLR may exceed or fall short of the global average SLR.
The Growing Threat of Sea Level Rise (SLR):
- Cities frequently identified as vulnerable to climate change include Guangzhou, Jakarta, Miami, and Manila.
- In 2019, President Joko Widodo of Indonesia declared the relocation of the nation’s capital from Jakarta to East Kalimantan, situated on the less densely populated island of Borneo.
- The dual challenges of climate change and severe traffic congestion are contributing to Jakarta’s status as the ‘world’s fastest-sinking city,’ with the city subsiding approximately 25 centimeters annually.
- Similarly, Mumbai faces a dire future; projections indicate that substantial areas of the city may be submerged due to climate change by the year 2050.
Strategies for Mitigating Sea Level Rise (SLR):
- The Intergovernmental Panel on Climate Change (IPCC) published a Special Report addressing the Ocean and Cryosphere in the context of a changing climate, which emphasized that effectively designed coastal protection measures could significantly mitigate anticipated damages while also proving to be economically viable for urban and densely populated regions.
- In 2014, the Indonesian government initiated a coastal development initiative known as the Giant Sea Wall or ‘Giant Garuda,’ named after the Garuda, a bird from Hindu mythology that serves as Indonesia’s national emblem.
- Additionally, the Northern European Enclosure Dam (NEED) is a proposed infrastructure project aimed at safeguarding 25 million individuals and critical economic areas in Europe from the threats posed by rising sea levels attributed to climate change.
- This ambitious plan entails the construction of two dams with a total length of 637 kilometers, designed to shield Northern Europe from the inevitable impacts of sea level rise.
- It has been recognized that various areas, including the Persian Gulf, the Mediterranean Sea, the Baltic Sea, and the Red Sea, could gain advantages from implementing comparable enclosures.
Tropical Cyclones are Becoming More Severe:
Tropical cyclones necessitate a sea surface temperature (SST) of at least 26.5°C for their formation, whereas the most intense storms demand significantly higher SSTs ranging from 28 to 29°C. Moreover, the occurrence of frequent high-intensity storms has been associated with exceptionally warm SSTs exceeding 30°C.
- The South Indian Ocean, which once recorded temperatures of 26.5°C, is now witnessing a rise in temperatures reaching between 30°C and 32°C.
- This increase in oceanic temperatures contributed to the formation of the catastrophic Idai cyclone in March 2019, resulting in over 1,300 fatalities in the southwestern Indian Ocean basin, particularly affecting Southeast Africa.
- Additionally, regions situated further from the equator are increasingly encountering the critical temperature range of 24°C to 26°C, thereby expanding the potential for tropical cyclone development.
- These phenomena are further intensified by global climatic influences such as El Niño, the Indian Ocean Dipole, the Southern Annular Mode, and the Madden-Julian Oscillation, all of which are in turn influenced by the overarching effects of global warming.
- This information is elaborated upon in the PMF IAS Physical Geography course, specifically within the climatology section.
Unusual Timing & High Frequency:
- The Extremely Severe Cyclonic Storm Fani, which occurred in April 2019, represents the most powerful cyclone to strike India in the month of April in over four decades.
- This atypical occurrence in April is believed to be linked to the effects of global warming, particularly the anomalous rise in temperatures in the Bay of Bengal.
- Furthermore, the frequency of severe cyclones in the northern Indian Ocean has seen a significant increase, with occurrences rising from approximately one severe cyclone annually during the peak cyclonic months of May, October, and November, to an alarming rate of about three per year.
The number and intensity of tropical cyclones is increasing in the Arabian Sea:
- Nearly half of the storms fail to persist over the Arabian Sea, primarily because the west-central and northern regions of the sea experience relatively lower sea surface temperatures (SST) due to the influence of the Findlater/Somali Current, which induces local upwelling.
- This phenomenon is, however, undergoing a transformation. The Arabian Sea is experiencing a rapid increase in temperature, which is contributing to a rise in cyclone activity and leading to excessive rainfall patterns.
- This excessive precipitation over the sea results in diminished moisture availability in the monsoon winds, consequently causing reduced rainfall on the mainland. Climate models indicate that approximately 64 percent of the cyclone risk in the Arabian Sea can be attributed to climate change.
Increased occurrence of Severe cyclonic storms:
Historically, the region experienced one exceptionally severe cyclone approximately every four to five years. Notably, between 1998 and 2013, the Sea witnessed the formation of five extremely severe cyclones. However, in recent times, the Arabian Sea has been increasingly subjected to high-intensity tropical cyclones.
Unusual timing:
In June 2019, the Arabian Sea experienced a Very Severe Cyclonic Storm named Vayu, which is noteworthy because the climatic conditions during this month typically do not favor the development of severe cyclones, as the onset of the monsoon season usually disrupts such formations.
Changing path:
Historically, tropical cyclones in the Arabian Sea were primarily confined to the region of Gujarat; however, over the last ten years, the states of Kerala and Karnataka have increasingly experienced susceptibility to these severe weather events.
Deterioration of Carbon sinks:
- Forests located at high latitudes are more effective at sequestering carbon than tropical rainforests, with approximately one-third of the planet’s soil-stored carbon found in taiga and tundra regions.
- The melting of permafrost, a consequence of global warming, results in the release of carbon in the forms of carbon dioxide and methane.
- In the 1970s, the tundra functioned as a carbon sink, absorbing more carbon than it emitted; however, it has transitioned into a carbon source in contemporary times, primarily due to the effects of global warming, which creates a positive feedback loop that exacerbates the situation.
Carbon Dioxide Fertilization:
- The vegetated areas of Earth have experienced a notable increase in greenness, primarily attributed to elevated levels of atmospheric carbon dioxide, which enhances the process of photosynthesis.
- This phenomenon, known as carbon dioxide fertilization, accounts for approximately 70 percent of the observed greening, while nitrogen contributes around 9 percent.
- Additional factors such as alterations in land cover, variations in precipitation, and changes in sunlight also play a role in this process.
- However, it is important to note that as plants adapt to the increasing concentrations of carbon dioxide, the benefits of this fertilization effect may wane over time.
- Consequently, while elevated CO2 levels may yield short-term advantages for plant growth, they pose long-term risks associated with climate change.
Carbon Fertilization is increasing carbon sink on land:
Annually, approximately 50% of the 10 gigatons of carbon released into the atmosphere due to human activities is temporarily sequestered, with roughly equal contributions from both the oceans and terrestrial vegetation. Research has indicated a growing carbon sink on land since the 1980s, aligning perfectly with the concept of a progressively greener planet.
Climate Migrants:
- Environmental migrants are individuals who have been forced to relocate as a result of detrimental alterations to their surrounding environment.
- Specifically, climate migrants are those displaced by the effects of climate change, which include phenomena such as rising sea levels in the Sundarbans, flooding in the Ganges and Brahmaputra river basins, and drought conditions affecting central regions of India, including Vidarbha, Telangana, and Rayalaseema.
- According to the National Sample Survey Office (NSSO) report from 2007-08, entitled ‘Migration in India’, natural disasters were identified as a significant factor contributing to migration, accounting for approximately 13 out of every 1,000 migrants.
- The increase in displacement and migration resulting from such disasters has raised alarms regarding the potential for heightened human trafficking, conflicts, and increased strain on available resources.
World Risk Index (WRI) 2020:
- According to the World Risk Index (WRI) 2020, India was inadequately equipped to confront the realities of climate change, rendering it particularly susceptible to severe natural disasters.
- The report ranked India 89th out of 181 nations, positioning it as the fourth most at-risk country in South Asia, trailing behind Bangladesh, Afghanistan, and Pakistan.
- In comparison, Sri Lanka, Bhutan, and the Maldives demonstrated superior resilience in managing extreme disasters.
- Furthermore, the report highlighted Africa as a region of significant vulnerability, with the Central African Republic identified as the most at-risk nation, followed by Chad, the Democratic Republic of Congo, Niger, and Guinea-Bissau.
High And Low Risk Nations:
The index indicated that Oceania, which includes the Small Island Developing States (SIDS), is the continent facing the greatest risk, with Africa and the Americas following closely behind. Among the nations, Vanuatu emerged as the one with the highest disaster risk globally, succeeded by Tonga and Dominica. In contrast, Qatar was identified as having the lowest risk level, recorded at 0.31, according to the global index.
Other Impacts:
Economic Losses:
- The economic repercussions incurred encompass expenditures related to adaptation strategies for climate change, such as relocating from areas prone to flooding to more secure elevations, the costs associated with reconstruction following severe climatic events, and investments in climate change mitigation efforts, including carbon sequestration initiatives.
- The economic losses attributed to the release of one ton of carbon dioxide into the atmosphere are referred to as the social cost of carbon, quantified in monetary terms.
- In India, the estimated social cost of carbon emissions is notably the highest globally, at $86 per ton of CO2, indicating that the Indian economy incurs a loss of $86 for each additional ton of CO2 emitted.
- The United States follows, with an estimated economic damage of $48 per ton of CO2 emissions.
Ocean Deoxygenation:
- The phenomenon of ocean deoxygenation refers to the increasing prevalence of oxygen minimum zones (OMZs) across the global oceans, primarily driven by human-induced carbon dioxide emissions.
- These OMZs typically occur in regions where a combination of physical factors, such as ocean stratification, and biological factors, including reduced photosynthesis, leads to the formation of anoxic zones characterized by diminished oxygen levels.
- Additionally, the warming of ocean waters contributes to deoxygenation, as warmer temperatures reduce the solubility of oxygen and promote stratification driven by temperature variations.
Effects of deoxygenation of oceans:
The depletion of oxygen in oceanic environments leads to increased acidity, which adversely affects shellfish by degrading their shells. Additionally, there is a significant decline in the cycling of vital elements such as carbon, nitrogen, and phosphorus, which are crucial for sustaining various life forms. This ecological imbalance results in substantial fish mortality, primarily due to the diminished availability of phytoplankton, their primary food source.
Biodiversity Loss:
The bleaching of coral reefs, often referred to as the rainforests of the ocean, along with the decline of plankton populations resulting from rising sea temperatures, will have detrimental effects on marine food chains, leading to a significant reduction in marine biodiversity.
Food and Health Security at Risk:
- Climate change significantly influences agricultural productivity by altering irrigation practices, sunlight exposure, and the incidence of pests.
- The increasing frequency of extreme weather events such as droughts, floods, storms, and cyclones is expected to heighten the variability in agricultural output.
- Additionally, rising temperatures will lead to a greater demand for fertilizers, which in turn will elevate greenhouse gas emissions, ammonia volatilization, and the overall costs associated with crop production.
- While a moderate increase in mean temperatures (ranging from 1 to 3°C) may enhance crop yields in temperate regions, it is anticipated that crops in lower latitudes will suffer adverse effects.
- Nonetheless, the benefits of temperature increases in temperate areas may be negated by the natural disasters linked to global warming.
- Furthermore, the scarcity of freshwater during droughts and the contamination of water supplies during floods pose significant hygiene challenges, thereby increasing the incidence of diseases such as cholera and diarrhea.
- The proliferation of diseases, including malaria, in tropical regions will further strain healthcare systems.
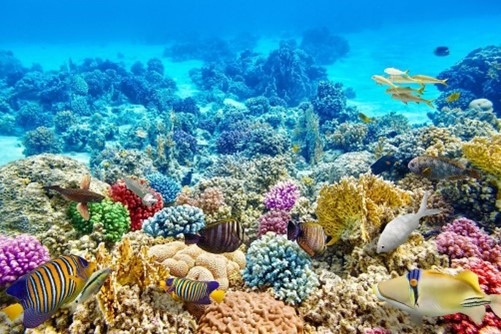
Coral Bleaching or Coral Reef Bleaching:
Coral reef bleaching represents a common reaction of corals to multiple environmental stressors. Recently, however, the impacts of global warming and related events, such as marine heat waves and alterations in rainfall patterns, have led to extensive coral bleaching incidents, necessitating over 15 years for corals to recuperate fully.
Coral Reefs:
- Coral reefs are composed of the calcareous structures formed by countless minute marine organisms known as coral polyps, which are classified within the phylum Cnidaria, sharing a close relationship with anemones and jellyfish.
- These polyps exhibit a variety of forms and colors, influenced by the specific salts that constitute their composition.
- Coral polyps thrive in warm, shallow waters and possess soft bodies that are encased in calcareous skeletons.
- They extract calcium salts from the surrounding seawater to create these robust, tubular structures.
- Additionally, small marine plants, such as algae, contribute to coral growth by depositing calcium carbonate.
- Polyps exist in colonies on the ocean floor, forming a solid calcareous mass collectively referred to as corals.
- Upon the death of coral polyps, their skeletons are left behind, providing a substrate for new polyps to develop, thus perpetuating a cycle that spans millions of years and results in the accumulation of coral layers.
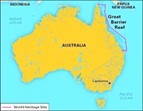
- The uppermost layers formed through these deposits are recognized as coral reefs. The Great Barrier Reef (GBR), extending 2300 kilometers along the northeastern coast of Australia, holds the title of the largest reef globally.
- It is important to note that the GBR is not a singular entity but rather a vast complex comprising numerous reefs.
- In India, significant coral reef regions can be found in the Andaman and Nicobar Islands, Lakshadweep, the Gulf of Mannar, and the Gulf of Kachchh.
- Over time, certain coral reefs may undergo transformation, evolving into coral islands, as exemplified by Lakshadweep.
Ideal Conditions for Coral Growth:
- Coral reefs flourish in environments characterized by stable climatic conditions, as they are particularly sensitive to rapid fluctuations in their surroundings.
- These organisms predominantly inhabit equatorial oceans, where warm ocean currents contribute to a consistent climate over extended periods.
- Additionally, corals thrive in tropical waters, specifically between latitudes 30°N and 30°S, where temperatures hover around 20°C and exhibit minimal diurnal and annual variations.
- Notably, coral reefs are absent from the western coasts of tropical continents due to the influence of cold ocean currents.
- Furthermore, corals require shallow waters to access sufficient sunlight for photosynthesis, with optimal growth occurring at depths between 45 m and 55 m below the sea surface.
- The clarity of the saltwater is also crucial, as corals flourish in clear environments while being adversely affected by freshwater and highly saline conditions.
- An abundant supply of plankton is essential, as it provides necessary oxygen and serves as a food source; thus, corals tend to proliferate on the seaward side where plankton is more plentiful.
- Lastly, corals are extremely delicate and susceptible to the impacts of climate change and pollution, with even slight increases in marine pollution posing significant threats to their survival.
Corals and Zooxanthellae:
- Numerous invertebrates, vertebrates, and plant species coexist in close proximity to corals, engaging in a tightly interlinked system of resource utilization and recycling.
- This intricate relationship contributes to the remarkable productivity and biodiversity of coral reefs, which are often likened to the ‘Tropical Rainforests of the Oceans.
- ‘Scleractinian corals, commonly known as stony or hard corals, construct their calcium carbonate skeletons by extracting calcium from the surrounding water.
- These corals obtain their nutrients and energy through two primary mechanisms: firstly, by employing the traditional cnidarian method of capturing small planktonic organisms with their tentacles, and secondly, through a symbiotic association with zooxanthellae, a type of single-celled photosynthetic alga that belongs to various taxa within the phylum Dinoflagellata.
Symbiotic Relationship Between Corals & Zooxanthellae:
- Zooxanthellae exist in a symbiotic relationship with coral polyps, residing within their tissues as clusters of cells.
- These organisms play a crucial role in aiding corals by facilitating nutrient production through photosynthesis, which generates fixed carbon compounds that serve as energy sources.
- This process not only promotes calcification but also regulates the flow of essential nutrients.
- In exchange, the coral polyps offer zooxanthellae a secure habitat and a continuous supply of carbon dioxide necessary for their photosynthetic activities.
- This mutualistic interaction enables the relatively slow-growing corals to effectively compete against faster-growing multicellular algae.
- Corals engage in photosynthesis during the day, thanks to the zooxanthellae, and supplement their nutrition at night through predation.
- Furthermore, the inherent transparency of coral tissues allows for the vibrant coloration that is attributed to the presence of zooxanthellae within them.
Causes for Coral Bleaching:
- Coral reefs are subjected to various disturbances, both anthropogenic and natural in origin.
- The recent rapid decline of these ecosystems is predominantly attributed to human activities such as overexploitation, overfishing, increased sedimentation, and nutrient overload.
- Natural disturbances that impact coral reefs include severe storms, flooding, temperature extremes, events associated with the El Niño Southern Oscillation (ENSO), exposure to air, outbreaks of predators, and epizootics, which are epidemics affecting animal populations.
- A common response of corals to these stressors is bleaching, which occurs when there is a significant reduction in the density of zooxanthellae or a decrease in the concentration of photosynthetic pigments within these symbiotic algae.
- During bleaching events, corals can lose between 60-90% of their zooxanthellae, with individual zooxanthellae potentially losing 50-80% of their photosynthetic pigments.
- If the stress leading to bleaching is not excessively severe and subsides over time, corals typically can recover their symbiotic algae within a few weeks to months.
- However, if the loss of zooxanthellae persists due to ongoing stress and the populations do not rebound, the coral host is likely to perish.
Ecological Causes of Coral Bleaching:
Temperature Changes:
- Coral species, akin to the majority of marine organisms, thrive within a limited temperature range.
- Even minor fluctuations in temperature over extended periods, or significant shifts of 3-4 °C within a few days, can lead to dysfunction in corals and trigger coral bleaching.
- Such bleaching events predominantly take place during prolonged warming phases, particularly in summer.
- Additionally, they have been observed under conditions of low wind speeds, clear skies, calm seas, and reduced turbidity, all of which contribute to localized heating and increased ultraviolet (UV) radiation that penetrates the clear waters.
- Although corals possess UV-absorbing compounds, the rise in temperatures results in a diminished concentration of these protective substances.
- Furthermore, bleaching can also occur during abrupt temperature declines associated with intense upwelling phenomena, such as El Niño, as well as during seasonal outbreaks of cold air.
Ocean Acidification:
The increase in temperatures has led to a higher occurrence and severity of coral bleaching, while the process of acidification has diminished the corals’ capacity to calcify.
Subaerial exposure:
The abrupt exposure of coral reefs to the air during extreme low tides, fluctuations in sea levels associated with the El Niño-Southern Oscillation (ENSO), or tectonic uplift may lead to coral bleaching. This exposure can result in varying temperatures, heightened solar radiation, drying out of the corals, and dilution of seawater due to heavy rainfall, all of which could contribute to the loss of zooxanthellae.
Inorganic Nutrients:
An increase in the concentration of ambient elemental nutrients, such as ammonia and nitrate, does not lead to coral reef bleaching; instead, it results in a two to threefold increase in the density of zooxanthellae. While eutrophication, characterized by an overabundance of nutrients that leads to harmful algal blooms, does not directly contribute to the loss of zooxanthellae, it may have indirect negative consequences, including a reduction in the corals’ ability to withstand diseases.
Xenobiotics:
Xenobiotics refer to chemical compounds that are not naturally found within animal organisms. The exposure of corals to elevated levels of chemical pollutants, such as copper, herbicides, and oil, leads to the phenomenon known as coral bleaching.
Epizootics:
Numerous coral diseases lead to either localized or complete mortality of colonies, primarily due to the shedding of soft tissues, which exposes a white skeleton; this should not be mistaken for coral bleaching. Interestingly, studies indicate that corals subjected to consistently lower stress levels may acquire a degree of resistance to the bleaching phenomenon.
Australia’s Great Barrier Reef:
- The Great Barrier Reef, comprising more than 2,900 distinct coral reefs, stands as the largest reef system globally, situated in the Coral Sea off the coast of Queensland, Australia.
- This remarkable structure, recognized as the most significant single formation created by living organisms, is so vast that it is visible from outer space.
- It serves as a vital habitat for species such as the dugong and the green turtle and was designated a World Heritage Site in 1981.
- However, the International Union for Conservation of Nature (IUCN) has reported that the Great Barrier Reef is currently in a ‘critical state and deteriorating’ due to the impacts of climate change, which has led to rising water temperatures.
- Consequently, its conservation status has been downgraded from ‘significant concern’ to ‘critical,’ following a series of mass bleaching events, four of which have occurred in the last six years.
- A mission supported by the United Nations has suggested that the Great Barrier Reef be considered for inclusion on the list of endangered World Heritage sites, although this has not yet been implemented.
The Threat of Coal Mining:
- Australia ranks among the foremost global exporters of fossil fuels, with its reef ecosystems facing significant threats from coal mining, gas extraction, and the construction of ports for mining vessels.
- In 2018, the Australian government sanctioned the $16.5 billion Carmichael coal-mining initiative by Adani in the Galilee Basin, which is recognized as one of the largest unexploited coal reserves in Queensland.
- This mine is set to be linked to the Abbot Port, which is managed by Adani, and is expected to produce thermal coal for electricity generation, while metallurgical coal, or coke, will be utilized in steel production.
- The project sparked widespread protests. Notably, in February 2023, Australia, which heavily relies on coal for its electricity needs, made a historic decision to deny a new coal mining application for the first time, citing concerns over the potential detrimental effects of the open-pit mine on the adjacent Great Barrier Reef.
- The proposed project was deemed to pose unacceptable risks to the delicate seagrass meadows that are vital for the sustenance of dugongs.
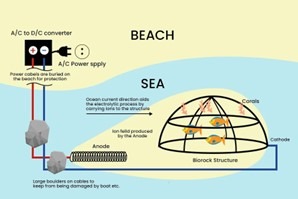
Biorock Technology for Coral Restoration:
- The Zoological Survey of India has initiated efforts to rehabilitate coral reefs in the Gulf of Kachchh through the application of biorock technology.
- If these efforts prove effective, this innovative approach could significantly contribute to the restoration of damaged coral ecosystems.
- Biorock is created through the process of mineral accretion, which involves the electro-accumulation of minerals on submerged steel structures that are connected to a power source, such as floating solar panels.
- The mechanism of this technology involves the passage of a low-level electrical current through electrodes submerged in seawater.
- This current facilitates the interaction between calcium ions and carbonate ions, resulting in the deposition of calcium carbonate (CaCO3) on the cathode located on the ocean floor. This deposited material is referred to as biorock.
- Additionally, fragments of damaged corals are affixed to the biorock structure, allowing coral larvae to attach to the calcium carbonate, thereby accelerating their growth as they do not need to expend energy on the formation of their own calcium carbonate skeletons.
Intergovernmental Panel on Climate Change (IPCC):
- The Intergovernmental Panel on Climate Change (IPCC) serves as the United Nations entity responsible for evaluating scientific knowledge pertaining to climate change.
- Founded in 1988 through a collaboration between the United Nations Environment Programme (UNEP) and the World Meteorological Organization (WMO), the IPCC generates comprehensive reports that aid the United Nations Framework Convention on Climate Change (UNFCCC).
- These reports encompass critical data necessary for comprehending the risks associated with anthropogenic climate change, its possible consequences, and strategies for both adaptation and mitigation.
IPCC Reports:
The Intergovernmental Panel on Climate Change (IPCC) does not conduct its own primary research; instead, it relies on the voluntary contributions of thousands of scientists and experts.
This collaborative effort is organized into three Working Groups (WG), along with a Task Force and a Task Group.
- WG I is dedicated to evaluating the physical scientific foundations of the climate system and the phenomenon of climate change.
- WG II focuses on analyzing the susceptibility of socio-economic and natural systems to the effects of climate change.
- Meanwhile, WG III is concerned with climate change mitigation, examining strategies for decreasing greenhouse gas emissions and removing these gases from the atmosphere.
The findings produced by these Working Groups are periodically published by the IPCC in comprehensive Assessment Reports, which aim to enhance the understanding of anthropogenic climate change, its potential impacts, and the various options available for mitigation and adaptation.
IPCC Assessment Reports (ARs):
- Following the establishment of the Intergovernmental Panel on Climate Change (IPCC) in 1988, the first Assessment Report (AR1) was released in 1990, with an update issued in 1992.
- Subsequent editions of the IPCC Assessment Reports were published approximately every six years, including AR2 in 1995, AR3 in 2001, AR4 in 2007, and AR5 in 2014.
- Currently, the IPCC is engaged in its sixth Assessment Cycle, which encompasses the production of various reports, including Assessment Reports from its three Working Groups (WGs), three special reports (SR1.5, SRCCL, and SROCC), an updated methodology report, and the Synthesis Report, which will conclude the AR6 series.
Notably, in August 2021, the Working Group I contributed to the AR6 with the report titled ‘Climate Change 2021: The Physical Science Basis.
- ‘ This was followed by the Working Group II’s report in February 2022, ‘Climate Change 2022: Impacts, Adaptation and Vulnerability,’ and the Working Group III’s report in April 2022, ‘Climate Change 2022: Mitigation of Climate Change.
- ‘ The Synthesis Report, which is the final output of the AR6, is anticipated to be published in March 2023, serving to inform the 2023 Global Stocktake under the United Nations Framework Convention on Climate Change (UNFCCC).
AR1 (1990):
- Over the past century, global temperatures have experienced an increase ranging from 0.3 to 0.6 degrees Celsius.
- If current trends continue without significant intervention, projections indicate a potential rise of 2 degrees Celsius relative to pre-industrial levels by the year 2025, and an alarming increase of 4 degrees Celsius by 2100.
- Additionally, sea levels are expected to rise by approximately 65 centimeters by the end of the century.
- This analysis served as a foundational document for the United Nations Framework Convention on Climate Change (UNFCCC) established in 1992.
AR2 (1995):
- The report updated the earlier forecast for a global temperature increase to 3 degrees Celsius by the year 2100, along with a projected sea level rise of 50 centimeters.
- This document served as a foundational reference for the Kyoto Protocol.
AR3 (2001):
- The forecasted temperature range has been updated to between 1.4 and 5.8 degrees Celsius by the year 2100, relative to the levels recorded in 1990.
- Additionally, it is anticipated that rainfall will increase, and sea levels are projected to rise by approximately 80 centimeters from the 1990 baseline by the year 2100.
AR4 (2007):
- The Intergovernmental Panel on Climate Change (IPCC) was awarded the Nobel Peace Prize for its efforts in addressing climate change.
- In a dire scenario, it is projected that global temperatures may increase by 4.5 degrees Celsius by the year 2100 compared to pre-industrial levels, with sea levels potentially rising by 60 centimeters relative to their 1990 measurements.
AR5 (2014):
- By the year 2100, it is projected that temperatures may increase by as much as 4.8 degrees Celsius compared to pre-industrial levels.
- Furthermore, the concentrations of atmospheric gases such as carbon dioxide (CO2), methane (CH4), and nitrous oxide (N2O) have reached levels that are unprecedented in the last 800,000 years.
- The occurrence of heat waves is expected to become more frequent and prolonged, a scenario that is deemed ‘virtually certain.’ Additionally, a significant proportion of species is at risk of extinction.
- This report served as the scientific foundation for the Paris Agreement.
WG I to AR6 (Feb 2021):
- The global average air temperature is projected to exceed the 1.5°C threshold relative to pre-industrial levels between 2021 and 2040.
- For the first time, the Intergovernmental Panel on Climate Change (IPCC) has indicated that reaching the 1.5°C increase is unavoidable, even under optimal conditions.
- This level of warming is expected to result in more frequent heat waves, extended warm seasons, and reduced cold seasons.
- However, if greenhouse gas emissions are cut by 50% by 2030 and achieve net-zero by 2050, it may be possible to halt further global warming.
- The report reinforces India’s position that the historical accumulation of emissions is a primary driver of the current climate crisis.
- Additionally, escalating air pollution has led to a decrease in both the intensity and frequency of monsoon rains across India and South Asia.
- Urbanization has also contributed to increased rainfall intensity in urban areas of South Asia, as evidenced by various scientific studies conducted in Indian cities.
WG II to AR6 (Feb 2022):
- Urban areas, which accommodate over fifty percent of the global population, are particularly vulnerable to the effects of climate change.
- The detrimental consequences and associated losses intensify with each rise in global temperatures. At a global warming threshold of 1.5 °C above pre-industrial levels, approximately 14% of species are at a significantly elevated risk of extinction.
- This risk escalates to 29% at 3 °C and reaches 39% at 4 °C of warming. Certain losses driven by climate change, such as the extinction of species, are irreversible, while others are nearing a point of no return due to the rapid pace of climate change.
- This includes phenomena like glacier retreat and permafrost thawing, especially in the Arctic. Furthermore, climate change has had a definitive impact on both the physical and mental well-being of individuals globally.
- As the crisis deepens, human societies will increasingly contend with challenges such as heat stress, water shortages, threats to food security, and heightened flood risks.
WG III to AR6 (Apr 2022):
- In 2019, greenhouse gas emissions resulting from human activities amounted to 59 gigatons of carbon dioxide equivalent (GtCO2e), reflecting a 54% increase since 1990.
- The average annual growth rate during the decade from 2010 to 2019 decelerated to 3% per year, in contrast to the 2.1% annual growth rate observed from 2000 to 2009.
- Furthermore, at least 18 nations have successfully decreased their greenhouse gas emissions for over a decade, attributed to the decarbonization of their energy systems, the implementation of energy efficiency initiatives, and a decline in energy demand.
Emission by the Least Developed Countries:
- Carbon inequality continues to be a significant issue, as evidenced by the fact that in 2019, Least Developed Countries (LDCs) accounted for merely 3% of global emissions.
- During the period from 1990 to 2019, their average per capita emissions were only 1.7 tonnes of CO2 equivalent, in stark contrast to the global average of 6.9 tonnes CO2 equivalent.
- Furthermore, LDCs have contributed less than 0.4% to the total historical CO2 emissions resulting from fossil fuels and industrial activities from 1850 to 2019.
- Additionally, in 2019, 41% of the global population resided in nations that emitted less than 3 tonnes of CO2 equivalent per capita.
Insufficient Pledges & Rising Temperatures:
The phenomenon of global warming is projected to exceed 1.5°C within this century as a result of ongoing reliance on fossil fuels, thereby undermining the objectives set forth in the Paris Agreement. To adhere to the C1 pathway, it is imperative that greenhouse gas emissions are reduced by 43% by the year 2030, ensuring that there is little to no overshoot in temperature increases.
Recommended Solutions:
- The swift advancement of renewable energy sources and the adoption of electric vehicles is essential, emphasizing the urgent need for a transition towards solar and wind energy, as well as electric transportation.
- Additionally, implementing carbon removal strategies, whether through natural methods such as afforestation or technological solutions like carbon capture, is crucial, even when considering high-risk techniques like aerosol injection to reflect sunlight.
- Furthermore, it is imperative to focus on reducing methane emissions from sources such as mines, wells, and landfills, given that methane is a highly effective greenhouse gas.
Low-Emission Technologies & Cost Reductions:
- Since 2010, there has been a significant decline in the costs associated with clean technologies, with solar power prices decreasing by 85%, wind energy costs dropping by 55%, and lithium-ion battery prices also falling by 85%.
- Concurrently, the deployment of these technologies has seen remarkable growth, as solar energy utilization has expanded tenfold, while the adoption of electric vehicles has skyrocketed by a factor of 100.
Land use patterns and climate change:
The Intergovernmental Panel on Climate Change (IPCC) has directed its focus exclusively towards the land sector in preparation for its forthcoming AR6 report in 2022. This report will provide the latest insights into the ways in which various land uses, including forestry, agriculture, and urban development, are both influencing and being influenced by climate change.
The contribution of land use patterns to climate change:
- Agricultural practices and livestock management are significant contributors to the emissions of methane and nitrous oxide, both of which are potent greenhouse gases (GHGs).
- When accounting for pre-production activities such as livestock rearing, alongside post-production processes including transportation and food processing, it is estimated that food production may account for as much as 37% of total annual GHG emissions.
- Collectively, the food system is responsible for approximately 50% of global emissions, with agriculture contributing 15%, deforestation for food purposes 18%, and transportation, storage, processing, and waste management accounting for 17%.
- The Intergovernmental Panel on Climate Change (IPCC) has emphasized the necessity of enhancing access to coarse grains, legumes, fruits, vegetables, nuts, and seeds, while also advocating for a reduction in the carbon footprint associated with meat production.
- Alarmingly, nearly 25% of all food produced is either lost or wasted, and the decomposition of this waste further contributes to GHG emissions.
- Concurrently, natural processes such as photosynthesis in soil, trees, plantations, and forests play a crucial role in absorbing carbon dioxide, thereby mitigating atmospheric CO2 levels.
- Consequently, alterations in land use, including deforestation, urbanization, or shifts in cropping patterns, have a direct and significant impact on overall GHG emissions.
IPCC Special Reports:
The Intergovernmental Panel on Climate Change (IPCC) has produced comprehensive reports that examine the regional effects of climate change, the processes of carbon dioxide capture and storage, and the interconnections between the protection of the ozone layer and the global climate system.
In 2016, the IPCC launched three significant Special Reports:
- 5 (published in October 2018) focusing on the implications of a 1.5°C increase in global temperatures, SRCCL (released in August 2019) addressing the relationship between climate change and land use, and SROCC (issued in September 2019) which discusses the ocean and cryosphere in the context of a changing climate.
- The findings of SR1.5 highlight that to maintain global warming below 1.5°C, a 45% reduction in greenhouse gas emissions is necessary by 2030 relative to 2010 levels, with a target of achieving net-zero emissions by 2050.
- This net-zero concept involves balancing emissions through natural carbon sinks, such as forests and oceans, or through technological means of carbon dioxide removal.
- While some countries have made commitments to reach net-zero emissions, major emitters like China, the United States, and India have not yet made similar pledges.
- Current emission trends indicate that, if they continue at the present rate, the critical threshold of 1.5°C could be surpassed between 2030 and 2052, thereby exacerbating the risks associated with climate change.
Special Report on Climate Change and Land (SRCCL):
- The land report indicated that various land uses, including forestry, agriculture, industrial activities, and urban development, were responsible for the emission of approximately 5.2 gigatons of CO2 annually from 2007 to 2016.
- Concurrently, trees and forests played a significant role in sequestering nearly 11.2 gigatons of CO2 from the atmosphere each year.
- Consequently, the net effect of these processes resulted in land and its vegetation effectively removing around 6 gigatons of CO2 from the atmosphere on an annual basis.
- Furthermore, the report highlighted that the global food system, which encompasses agriculture, livestock production, food processing, transportation, and energy consumption, could contribute to nearly one-third of total greenhouse gas emissions. It also noted that approximately 25 percent of all food produced worldwide is either lost or wasted.
IPCC Special Report on the Ocean and Cryosphere in a Changing Climate (SROCC):
The IPCC Special Report on the Ocean and Cryosphere in a Changing Climate (SROCC) provides an updated synthesis of scientific literature published since 2015, following the 5th Assessment Report. This report encapsulates the severe consequences of global warming, drawing on the latest projections regarding greenhouse gas emissions worldwide.
Ocean warming:
- The world’s oceans have absorbed over 90% of the additional heat generated within the climate system. Since 1993, the pace of warming in the oceans has more than doubled.
- Furthermore, the frequency of marine heatwaves has likely increased twofold since 1982, with their intensity also on the rise.
- The oceans are experiencing warming, increased acidity, and a depletion of oxygen levels. The escalating temperatures are depleting oxygen in the upper water layers, which is detrimental to marine organisms, leading to the expansion of dead zones and disrupting the flow of ocean currents, which in turn affects weather patterns on land.
- Additionally, the long-term processes occurring in the oceans indicate that these changes will inevitably worsen over the coming centuries, even if all greenhouse gas emissions were to cease immediately.
Sea Level Rise:
- The increase in sea levels can be attributed to the thermal expansion of ocean waters resulting from elevated temperatures, alongside the melting of glaciers and polar ice caps. Over the past century, approximately 50% of coastal wetlands have been lost.
- Projections indicate that, without significant efforts to limit emissions to well below 2°C above pre-industrial levels, as outlined in the 2015 Paris climate agreement, global sea levels could rise by 1.1 meters by the year 2100.
- Even with successful emission reductions, a rise of 30 to 60 centimeters by 2100 remains a likely scenario.
Cryosphere:
- The cryosphere encompasses the frozen components of the Earth’s hydrosphere, including the polar regions and the snow caps found atop high mountain ranges.
- From 2006 to 2015, the Greenland ice sheet experienced an average annual loss of approximately 278 billion tons of ice, while the Antarctic ice sheet lost about 155 billion tons each year.
- Additionally, glaciers located outside these primary regions, such as those in the Himalayas, collectively lost an average of 220 billion tons of ice annually.
- This trend indicates that the rate of ice loss is greatest in the Arctic, followed by the Himalayas, and then the Antarctic.
- In the Himalayas, glaciers that supply water to ten major rivers, including the Ganges and the Yangtze, are at risk of significant reduction if greenhouse gas emissions remain unchecked, which would adversely affect water availability across Asia.
- Furthermore, the thawing of permafrost in regions like Alaska and Siberia poses a risk of releasing substantial amounts of greenhouse gases, potentially initiating feedback mechanisms that could accelerate global warming.

Suggested Solutions:
- A relatively simple approach to mitigating biodiversity decline, particularly in the context of climate change, involves the expansion of extensive protected areas both on land and in marine environments.
- Furthermore, the report emphasizes a more complex aspect of the solution: a swift decrease in greenhouse gas emissions is necessary across various institutional frameworks.
- It advocates for a five-fold increase in the nationally determined contributions (NDCs) that countries pledged under the 2015 Paris Agreement.
Climate Change Mitigation Measures:
Mitigating climate change entails both the prevention and reduction of greenhouse gas emissions released into the atmosphere, as well as the removal of existing emissions, in order to avert the escalation of global temperatures to more severe levels.
Clean coal technology to reduce CO2 Emissions:
- Approximately fifty percent of the global electricity supply is derived from coal combustion, which is expected to continue as a primary energy source for the foreseeable future.
- The combustion of coal releases significant quantities of greenhouse gases (GHGs), including carbon dioxide (CO2), nitrous oxide (N2O), and methane (CH4).
- In response to the environmental challenges posed by these emissions, clean coal technology has emerged, aiming to mitigate the release of GHGs through various innovative methods.
- Some of these technologies involve pre-combustion purification processes, while others focus on optimizing the combustion process itself to minimize emissions.
- For instance, coal preparation techniques, such as coal washing, enhance the quality of coal by eliminating undesirable minerals through a process that involves mixing crushed coal with a liquid, allowing impurities to settle.
- Additionally, electrostatic precipitators effectively capture particulate matter by charging particles within an electrical field and collecting them on designated plates.
- Another approach, coal gasification, circumvents direct combustion by reacting coal with steam and pressurized air or oxygen, resulting in syngas—a mixture of carbon monoxide and hydrogen—which is subsequently cleaned and utilized in gas turbines for electricity generation.
- Furthermore, wet scrubbers, also known as flue gas desulfurization systems, address sulfur dioxide emissions by treating flue gas with a mixture of limestone and water.
- Lastly, low-NOx burners are designed to minimize nitrogen oxide emissions by controlling oxygen levels and adjusting the combustion process.
India’s coal:
- The coal extracted in India is characterized by its inferior quality, as it is not Carboniferous coal but rather Gondwana coal, which contains lower carbon content, elevated ash levels that complicate disposal, and significant moisture content that leads to increased gas emissions and reduced fuel efficiency.
- To enhance energy efficiency and mitigate negative environmental impacts, it is imperative for India to phase out its existing sub-critical coal power plants in favor of constructing more super-critical and ultra-super-critical facilities, which could result in a 15-20% improvement in efficiency.
Carbon Capture and Storage:
- Carbon capture and storage (CCS) is a process that involves the capture and sequestration of carbon dioxide (CO2) emissions from fixed sources such as power generation facilities.
- The initial step in this process is the separation of CO2 from flue gases, which results in a concentrated stream of CO2. Following this capture, the CO2 is securely stored in containers to prevent its release back into the atmosphere.
- There are two primary methods for storing this captured CO2: geological storage, which entails injecting CO2 into underground formations, and oceanic storage.
- Geological storage can utilize depleted oil and gas reservoirs or deep saline aquifers, which are effective in safely containing CO2, while coal seams can also absorb the gas.
- Oceanic storage, although still in the developmental phase, involves the injection of liquid CO2 into deep ocean waters, ranging from 500 to 3,000 meters in depth, where it can dissolve under high pressure.
- However, this method raises concerns as it may lead to a slight decrease in ocean pH, resulting in acidification that could adversely affect marine ecosystems.
Carbon Capture Utilisation and Storage (CCUS):
- Carbon Capture, Utilization, and Storage (CCUS) refers to the methodology of capturing carbon dioxide emissions and either repurposing them for beneficial applications or securely storing them deep underground.
- As highlighted by Niti Aayog, CCUS is essential for India to achieve a 50% reduction in CO2 emissions by the year 2050.
- This strategy is pivotal for the nation to reach its commitment of net-zero CO2 emissions by 2070, as pledged during the COP 26 conference.
- Furthermore, CCUS is poised to facilitate the emergence of new sectors such as coal gasification and the hydrogen economy within India.
- It will aid in the transition from blue hydrogen to green hydrogen by fostering the development of necessary technologies and infrastructure for the production, storage, and transportation of hydrogen.
- Additionally, CCUS will enhance the valorization of CO2 by transforming it into various value-added products, including green urea, green ammonia, concrete and aggregates, methanol, ethanol, and bioplastics.
- This process aligns with the principles of a circular economy, emphasizing the importance of making, using, reusing, recycling, and reducing resources.
Carbon Sink and Carbon Sequestration:
- A carbon sink refers to either a natural or man-made reservoir that indefinitely collects and retains carbon-containing compounds.
- The mechanism through which these carbon sinks extract carbon dioxide (CO2) from the atmosphere is termed carbon sequestration.
- Examples of natural carbon sinks encompass forests, soil, and oceans; however, it is important to note that the ocean’s absorption of carbon dioxide leads to acidification, which poses a significant threat to marine species, particularly corals.
Carbon Sink vs Carbon Source:
- A carbon sink refers to any entity that sequesters more carbon than it emits, whereas a carbon source is defined as any entity that emits more carbon than it sequesters.
- Various natural systems, including forests, soils, oceans, and the atmosphere, serve as reservoirs for carbon, engaging in a dynamic exchange through what is known as the carbon cycle.
- This perpetual transfer of carbon results in these ecosystems functioning as either sources or sinks at different intervals.
Carbon sequestration:
Carbon sequestration refers to the method of capturing and storing atmospheric carbon dioxide over an extended period. This approach has been suggested as a means to mitigate the buildup of greenhouse gases in both the atmosphere and marine environments.
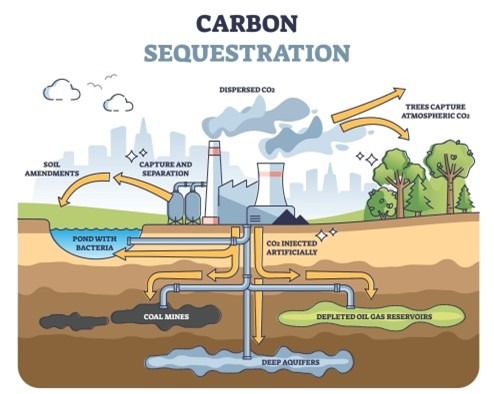
Forests as carbon Sinks:
- Trees play a crucial role in the carbon cycle by absorbing carbon dioxide (CO2) during the process of photosynthesis, which transforms atmospheric CO2 into organic matter.
- This organic matter, when buried, effectively sequesters carbon, creating a carbon sink. However, when this carbon sink is disturbed, the organic matter undergoes decomposition, resulting in the release of methane into the atmosphere.
- Additionally, the utilization of biomass as fuel sources, such as coal and petroleum, contributes to the emission of CO2, thereby acting as a carbon source. Furthermore, forests function as carbon dioxide sinks when they expand in density or area, but they transition into carbon sources when subjected to degradation.
Oceans as Carbon Sink:
- Blue carbon refers to the carbon that is sequestered by oceanic and coastal ecosystems, including seagrasses, mangroves, and salt marshes.
- Although these coastal systems occupy a smaller area compared to the world’s forests, they have a significantly higher rate of carbon sequestration and can maintain this process for millions of years.
- However, when these ecosystems are compromised, they release substantial quantities of carbon back into the atmosphere.
Geoengineering to Fight Climate Change:
- The Oxford Geoengineering Programme characterizes geoengineering as the intentional, large-scale manipulation of the Earth’s natural systems aimed at mitigating the effects of climate change.
- This encompasses a range of technologies, such as solar radiation management, the extraction of carbon dioxide and other greenhouse gases from the atmosphere, large-scale afforestation, and the preservation of the cryosphere.
Solar Radiation (Geoengineering) Management (SRM):
Solar Radiation Management (SRM) techniques are designed to redirect a fraction of the Sun’s energy back into space through various methods, including enhancing albedo by increasing the reflectivity of clouds or terrestrial surfaces, deploying space-based reflectors to obstruct a portion of sunlight prior to its arrival on Earth, and introducing reflective aerosols into the stratosphere to deflect sunlight before it can reach the Earth’s surface.
GHG Removal (GGR) or Carbon Geoengineering:
- Greenhouse gas removal (GGR) techniques are designed to extract carbon dioxide and other greenhouse gases from the atmosphere.
- These methods encompass a variety of approaches, including afforestation, which involves large-scale tree planting initiatives; biochar, which entails the pyrolysis of biomass followed by its burial to sequester carbon in the soil; and bio-energy with carbon capture and sequestration, where biomass is cultivated, combusted for energy, and the resultant carbon dioxide is captured and stored.
- Additionally, ambient air capture technology employs large-scale machinery to directly extract carbon dioxide from the air, provided that these systems operate with a net negative carbon balance, meaning they absorb more carbon than they emit.
- Ocean fertilization is another strategy that involves the deliberate addition of nutrients to specific oceanic regions to enhance primary production.
- Lastly, enhanced weathering involves the exposure of substantial amounts of minerals that chemically react with atmospheric carbon dioxide, with the intention of storing the resulting compounds in either the ocean or soil.
Forests for Carbon Geoengineering:
- In boreal forests, approximately 80% of the total carbon is sequestered in the soil in the form of dead organic matter, specifically peat.
- Conversely, tropical forests play a significant role in mitigating climate change by absorbing around 18% of the carbon dioxide emissions produced by fossil fuel combustion.
- There is considerable optimism surrounding the capacity of trees, various plant species, and soil to act as temporary carbon sinks for the carbon released into the atmosphere through fossil fuel usage.
- The Kyoto Protocol recognizes that the carbon dioxide absorption capabilities of trees and soil are equally legitimate methods for fulfilling emission reduction obligations, alongside the direct reduction of carbon emissions from fossil fuels.
Artificial snow:
- As a consequence of global warming, it is anticipated that the West Antarctic Ice Sheet will undergo disintegration from the Antarctic region.
- The resultant melting of this disintegrated ice sheet is projected to contribute to a global sea level rise of no less than 3 meters over the course of several centuries.
- In an effort to avert this catastrophic disintegration, a geoengineering initiative has been proposed, which entails covering the ice sheet’s surface with artificial snow.
- This approach involves the deployment of numerous wind turbines to elevate seawater approximately 1,500 meters to the surface, where it would be transformed into ‘snow’ in an attempt to apply sufficient weight to the ice sheet to prevent further collapse.
Transition Away from Coal:
- In order to restrict global warming to 1.5°C, it is essential that coal-generated electricity constitutes less than 1% of the worldwide energy portfolio by the year 2050.
- A strategic phased approach suggests prioritizing the decommissioning of older coal facilities, enabling developed countries to expedite the retirement of outdated infrastructure more swiftly than their developing counterparts, where newer coal plants are still being established.
Current initiatives:
To phase out coal include commitments from the UK, France, and Italy to eliminate unabated coal power by 2025, while Germany has set a target for 2038, which is deemed inadequate for meeting the 2°C climate objectives.
The Powering Past Coal Alliance, initiated at COP23, is working to synchronize coal phase-out strategies, with the goal of achieving coal elimination in OECD countries by 2030 and a global phase-out by 2050.
Coal Consumption Trends:
- However, the largest consumers of coal, including the US, Japan, China, and India, have not yet made formal commitments to phase out coal.
- Additionally, major coal-exporting nations such as Australia, Indonesia, Russia, and South Africa continue to supply the global market.
- Despite the reduction of coal use in Europe and OECD nations, consumption is on the rise in Africa and Asia, particularly in India, where a 29% increase is anticipated by 2040.
- Overall, global coal consumption is projected to grow by 5% from 2010 to 2040, driven by increasing demand in developing regions.
Challenges to coal transition:
The transition away from coal faces significant economic and political obstacles that overshadow technological challenges, including the issue of stranded assets resulting from the premature closure of coal plants, the potential displacement of jobs reliant on coal, the risk of higher short-term electricity costs associated with the shift to renewable energy, and irresponsible financing practices that continue to support coal, thereby impeding the advancement of clean energy alternatives.
Livelihood Impacts:
- In India, approximately one million individuals depend on the coal industry for either direct or indirect employment, with coal royalties contributing to 50% of the revenue for the states of Jharkhand and Odisha.
- In China, the coal sector employs around five million workers, a significant number of whom are off-farm laborers facing restricted employment opportunities.
- Meanwhile, in Australia, the coal mining sector provides jobs for 50,000 individuals, representing 0.4% of the total workforce, yet this aging workforce encounters challenges in acquiring new skills.
Stranded Assets & Infrastructure Challenges:
- Since 2006, India has incorporated 151 gigawatts of new coal power, predominantly consisting of 75% subcritical capacity, resulting in stranded assets estimated at $100 billion.
- In contrast, China has experienced an overextension of coal capacity attributed to policy misalignment, which has culminated in an oversupply issue.
- Meanwhile, Europe and the United States face a diminished concern regarding coal, as many plants approach the end of their operational lifespan.
- In the context of Australia and Indonesia, it is noteworthy that coal represented 15% of Australia’s total exports in 2017, while Indonesia, as the fifth-largest global producer, exports 80% of its coal production.
Electricity Price & Transition Challenges:
- In India, the current cost of coal power generation remains lower than that of renewable energy sources; however, newly initiated renewable energy projects are proving to be more economically viable compared to prospective investments in coal.
- To maintain a consistent supply of renewable energy, advancements in storage technology are essential. Additionally, there exists a significant tariff imbalance, where residential consumers benefit from lower electricity rates compared to industrial users, which diminishes the motivation for adopting renewable energy solutions.
Irresponsible financing:
- The number of nations utilizing coal power has increased from 66 in the year 2000 to 78 by 2018. This trend is largely influenced by major economies that are financing fossil fuel expansion in developing regions.
- Additionally, G20 countries have allocated more funding to international coal initiatives compared to renewable energy projects.
- Notably, Africa is experiencing a surge in the planning of coal power plants starting from 2018, which will necessitate more than eight times the current coal capacity of the region, as developed nations phase out their coal facilities and seek new markets for their coal in developing countries.
Climate Smart Cities:
- The term ‘climate-smart’ encompasses a holistic strategy for the management of urban landscapes and ecosystems, aimed at tackling the interconnected issues of sustainable development and climate change.
- Enhancing the resilience, sustainability, inclusivity, and safety of urban areas aligns with the United Nations’ Sustainable Development Goal 11.
- Urban centers contribute to approximately 70% of global greenhouse gas emissions, as highlighted in a UNDP report, and are disproportionately affected by the resulting challenges, including extreme heat events, urban heat islands, water shortages, flooding, public health crises, and social conflicts.
- Therefore, altering the heat-producing and heat-retaining characteristics of cities is essential for fostering their resilience and sustainability, ultimately leading to a reduction in their carbon emissions through decreased energy consumption.
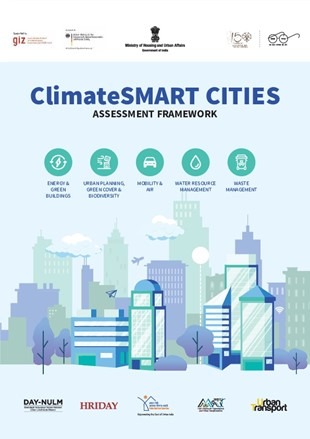
Measures Required to Reduce the Heat-Retaining Nature:
- In the realm of urban development and construction, it is advisable to implement lighter asphalt alternatives in both road construction and roofing applications.
- The adoption of cool pavements and rooftops, engineered to reflect a greater amount of sunlight while minimizing heat absorption, is essential.
- Additionally, the integration of green roofing systems, which incorporate vegetation, serves to further mitigate the demand for air conditioning.
- A strategic shift from traditional heat-retaining materials towards innovative construction technologies is necessary.
- Furthermore, promoting the decentralization of urban development and the establishment of eco-friendly cities, such as the Dholera Smart City in Gujarat, is crucial.
- Finally, relocating industries that contribute to pollution away from urban centers is imperative for sustainable city planning.
- Enhancing the coverage of trees and vegetation in urban areas is essential for mitigating the effects of heat waves, which should be regarded as natural disasters.
- It is crucial to improve the overall ventilation within cities. For instance, Stuttgart, Germany, situated in a region with limited wind flow, has systematically adopted policies aimed at enhancing air circulation.
- Similarly, Singapore’s government employs urban environmental modeling to strategically design and position residential blocks to optimize wind flow and provide shade in residential areas.
- Furthermore, it is important to formulate a strategy that integrates the green belt concept into urban planning and to establish building codes that promote passive cooling techniques, which utilize environmental energy to alleviate heat.
- Techniques such as double glazing, which minimizes heat transfer by employing two glass panes with a space filled with heat-retaining gases like argon, and evaporative cooling through fountains, which dissipates heat via the latent heat of evaporation, are effective methods to achieve these goals.
- Indirect radiant cooling involves the transfer of heat from materials with low thermal conductivity, such as human bodies and furniture, to materials with high thermal conductivity, such as metals.
Cooling Singapore – A Case Study:
- The Cooling Singapore initiative is a collaborative effort among various institutions designed to address the Urban Heat Island (UHI) phenomenon while simultaneously improving outdoor thermal comfort (OTC) within the urban environment.
- This project encompasses several key strategies:
- The implementation of green roofs and eco-roofs, which involve the installation of vegetative layers comprising plants, shrubs, grasses, and trees on rooftops to minimize heat absorption.
- Additionally, vertical greenery, or living walls, is utilized to cultivate vegetation on building facades, thereby contributing to the cooling of urban areas.
- The presence of trees and plants surrounding buildings serves to provide shade for pedestrians and ground surfaces, effectively reducing heat retention.
- Furthermore, the initiative promotes the adoption of green pavements, which replace conventional urban surfaces with grass and natural soil to decrease surface temperatures.
- Large-scale urban greening efforts aim to expand parks, forests, and natural reservoirs to combat the increasing temperatures prevalent in densely populated city regions.
- Urban farming is also encouraged, allowing for food cultivation within city boundaries, which supports environmental sustainability and localized cooling.
- Lastly, the Singapore District Cooling system features centralized cooling plants that achieve a remarkable 40% reduction in electricity consumption, thereby enhancing the efficiency of urban cooling solutions.
Measures Taken in India:
- In India, various initiatives have been implemented to combat urban heat, including the Cool Roof and Cool Pavement programs, which are integral to the heat action plans of Indian cities.
- These programs focus on lightening the colors of roofs and pavements to minimize heat absorption. Additionally, the National Mission on Sustainable Habitat seeks to facilitate a shift away from materials that retain heat.
- The Building Material and Technology Promotion Council (BMTPC), operating under the Union Ministry of Housing and Urban Affairs (MoHUA), advocates for the use of alternative materials and technologies.
- Furthermore, the Climate-Smart Cities Assessment Framework promotes a climate-sensitive approach to urban planning.
Climate-Smart Cities Assessment Framework (CSCAF):
- By the year 2030, it is projected that 40% of India’s population will reside in urban areas. In response to this anticipated growth, the Ministry of Housing and Urban Affairs (MoHUA) has launched various initiatives aimed at effectively managing urbanization.
- One notable initiative is the Climate-Smart Cities Assessment Framework (CSCAF), which seeks to integrate climate-conscious strategies into urban planning and development.
- This framework represents a commitment to adopting, implementing, and sharing exemplary practices from cities, while also establishing benchmarks in alignment with global efforts towards creating sustainable and resilient urban environments.
- The Climate Centre for Cities, part of the National Institute of Urban Affairs (NIUA), plays a crucial role in assisting MoHUA with the execution of the CSCAF.
- Additionally, other initiatives such as the Green India Mission (GIM), the National Clean Air Programme (NCAP), the Atal Mission for Rejuvenation and Urban Transformation (AMRUT), which focuses on enhancing basic urban amenities, the Swachh Bharat Mission, and Urban Transport initiatives are collectively contributing to the transformation of cities into Climate Smart entities.
Climate-Smart Cities Assessment Framework (CSCAF 2.0):
The Ministry of Housing and Urban Affairs (MoHUA) has introduced the Climate-Smart Cities Assessment Framework (CSCAF 2.0), which aims to offer a comprehensive guide for urban areas in their efforts to address Climate Change while formulating and executing their strategies.
This framework encompasses 28 indicators categorized into five distinct areas:
- Energy and Green Buildings,
- Urban Planning,
- Green Cover and Biodiversity,
- Mobility and Air Quality, as well as
- Water and Waste Management.
Green Rating for Integrated Habitat Assessment (GRIHA):
- The Green Rating for Integrated Habitat Assessment (GRIHA) serves as a national evaluation framework that measures the performance of buildings against established criteria.
- This tool assesses the environmental impact of a building in a comprehensive manner, thereby establishing a clear standard for defining a green building.
- GRIHA has been developed by The Energy & Resources Institute (TERI) with the collaboration of the Ministry of New & Renewable Energy (MNRE).
- The advantages of constructing green buildings include decreased energy usage while maintaining comfort levels, minimized disruption to natural ecosystems and biodiversity, reduced soil erosion, lower air and water pollution which contributes to public health benefits, decreased water usage, and limited waste production through recycling and reuse initiatives.
Transition to Green Economy:
- The transition to a green economy is underpinned by three fundamental priorities: the decarbonization of economic activities, the commitment of the environmental community to principles of justice and equity, and the conservation of the biosphere.
- To facilitate this transition, various measures can be implemented, such as conducting energy audits to minimize the climate impact of buildings, adopting sustainable fishing practices, and managing forests in a sustainable manner.
- Additionally, reducing paper consumption through the use of electronic files, supporting certified sustainable forest products, and promoting carpooling or public transportation are essential strategies. For short distances, walking or cycling can be encouraged, alongside wise water usage.
- The development of clean and renewable energy sources, including solar, wind, and tidal energy, is crucial for advancing a green economy.
- Furthermore, recycling materials and composting food waste are vital practices that contribute to sustainable development, highlighting the potential of a green economy to foster long-term ecological balance.
Green Contracts:
Green Contracts are defined as commercial agreements that require the involved parties to reduce greenhouse gas emissions throughout various phases of the delivery of goods and services. The initiation of a green contract’s implementation can begin as early as the bidding phase, during which multiple interested companies engage in the tendering process.
Green tender:
The Green tender may outline essential Green Qualifications that are taken into account during the contract award process to a bidder. After a bidder is selected, the contractual agreement between the involved parties can specify the green obligations in detail, thereby rendering these obligations legally binding and enforceable.
Benefits:
The reduction of carbon emissions contributes to enhanced corporate reputation within the marketplace, while also allowing companies to benefit from available tax incentives.
Challenges:
- The absence of a robust audit mechanism hinders the effective implementation of these contracts in both their letter and spirit.
- Furthermore, it is noteworthy that green contracts tend to incur higher costs compared to traditional brown contracts, which do not prioritize environmental considerations.