
Air Pollution: Effects and Control Measures:
Effects of Air Pollution:
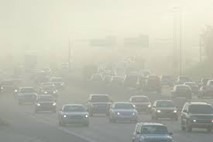
Smog (Smoke + Fog):
- Smog results from the combustion of coal, emissions from vehicles, and industrial exhaust, which are considered primary pollutants.
- It comprises soot particles, including smoke, ozone (O3), carbon monoxide (CO), sulfur dioxide (SO2), nitrogen dioxide (NO2), among others.
- There are at least two recognized categories of smog: sulfurous smog and photochemical smog.
Sulphurous Smog:
- Sulphurous smog, often referred to as London smog, originated in London during the industrial revolution.
- This phenomenon arises from elevated levels of sulphur oxides present in the atmosphere. The primary contributor to this smog is the combustion of sulphur-rich fossil fuels, especially coal, which is the main source of electricity generation in India.
- The severity of this smog is intensified by high humidity and an increased presence of suspended particulate matter in the air.
Photochemical Smog:
- Photochemical smog, often referred to as summer smog or Los Angeles smog, is primarily observed in urban regions characterized by significant vehicle emissions.
- This phenomenon arises when nitrogen oxides and volatile organic compounds interact under sunlight, leading to the formation of ozone, which is classified as a secondary pollutant.
- The resultant smog imparts a light brown hue to the atmosphere, diminishes visibility, harms vegetation, and causes eye irritation as well as respiratory issues.
- The levels of atmospheric pollution in cities such as Los Angeles, Beijing, and Delhi are exacerbated by temperature inversions, which confine smog close to the surface.
- This phenomenon poses significant health risks to humans, leading to serious illnesses and a decrease in life expectancy.
- Additionally, temperature inversions intensify, while precipitation diminishes as a result of the smog.
Haze:
- Haze is commonly understood as an atmospheric occurrence characterized by the presence of dust, smoke, and various dry particles that diminish the clarity of the sky, without the involvement of condensation.
- In contrast, smog resembles haze but is distinguished by the presence of condensation. The particles contributing to haze can originate from several sources, including agricultural activities (such as ploughing during dry conditions), vehicular emissions, industrial processes, and wildfires.
Impacts of Photochemical Smog:
- NO combined with volatile organic compounds (VOCs) leads to the formation of nitrogen dioxide (NO2).
- When nitrogen dioxide interacts with ultraviolet (UV) light, it produces nitrogen oxide (NO) and atomic oxygen (O).
- The atomic oxygen then reacts with molecular oxygen (O2) to generate ozone (O3).
- Additionally, nitrogen dioxide in conjunction with VOCs results in the creation of peroxyacetyl nitrate (PAN, C2H3NO5).
- In summary, the reaction of NO, VOCs, O2, and UV light yields ozone, PAN, and various other oxidants, including hydroxyl radicals (OH).
Nitrogen Oxides (NO and NO₂):
Sources:
- Emissions from the combustion of fossil fuels such as oil, coal, and gas.
- Natural occurrences including bacterial activity in soil, wildfires, volcanic eruptions, and lightning strikes.
Environmental Effects:
- Impairs visibility due to the yellowish hue of NO₂.
- Hinders the growth of plants.
Volatile Organic Compounds (VOCs):
Sources:
- Fuel evaporation.
- Incomplete combustion of fossil fuels.
Environmental and Health Effects:
- Induces irritation in the eyes and respiratory system; some compounds are known carcinogens.
- Diminishes visibility, resulting in a blue-brown haze.
Ozone (O₃):
Sources:
- Generated through the photolytic breakdown of NO₂.
- Occasionally produced by intrusions of stratospheric ozone.
Environmental Effects:
- Decreases agricultural yields and slows plant development.
- Causes deterioration of materials such as plastics and rubber.
Peroxyacetyl Nitrates (PAN):
Sources:
- Created through the reaction between NO₂ and VOCs.
Environmental and Health Effects:
- Leads to eye irritation and is extremely harmful to plant life.
- Causes damage to proteins.
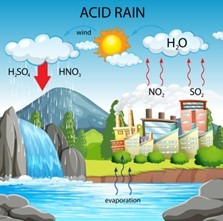
Acid Rain – Acidification:
Acid rain refers to any form of atmospheric precipitation—whether it be rain, snow, sleet, fog, or even dust—that has a higher-than-normal level of acidity, typically with a pH value below 5.6. Unlike pure water, which has a neutral pH of 7, acid rain contains dissolved sulphur dioxide (SO₂) and nitrogen oxides (NOₓ) released primarily from fossil fuel combustion, industrial processes, and vehicle emissions. These pollutants react with atmospheric moisture to form sulfuric and nitric acids, which are then deposited back to the Earth through precipitation.
The pH Scale: Measuring Acidity and Alkalinity
The pH scale is a scientific tool used to determine how acidic or basic (alkaline) a solution is. It operates on a logarithmic scale that ranges from 0 to 14, where each number represents a tenfold change in the concentration of hydrogen ions (H⁺) in a solution.
Key Points of the pH Scale:
- Neutral (pH = 7): Pure water is considered neutral. It has an equal concentration of hydrogen ions (H⁺) and hydroxide ions (OH⁻).
- Acidic (pH < 7): A solution is acidic if it contains more hydrogen ions than hydroxide ions. Examples include lemon juice, vinegar, and of course, acid rain.
- Alkaline or Basic (pH > 7): A solution is basic if it has fewer hydrogen ions and more hydroxide ions. Common bases include soap, bleach, and baking soda solutions.
Strength of Acidity: Exponential Nature of the pH Scale
One of the most important characteristics of the pH scale is its logarithmic progression. This means that:
- A pH of 4 is 10 times more acidic than a pH of 5, and
- It is 100 times more acidic than a pH of 6.
Even seemingly small changes in pH represent significant shifts in acidity levels, making even mildly acidic precipitation potentially harmful to ecosystems and infrastructure.
Relationship Between pH and Hydrogen Ion Concentration
The pH value of a solution is directly related to the concentration of hydrogen ions (H⁺) in that solution:
- Lower pH values indicate higher concentrations of hydrogen ions, which translates to stronger acidity.
- Conversely, higher pH values suggest lower hydrogen ion concentrations, indicating greater alkalinity.
While the standard pH scale is typically represented from 0 to 14, values can exist outside this range in highly concentrated acidic or basic solutions—such as battery acid (pH close to 0) or strong industrial bases (pH greater than 14).
Environmental Implications of Acid Rain
The effects of acid rain extend far beyond simply altering water pH:
- Soil Degradation: Acid rain leaches essential nutrients from the soil, reducing fertility and damaging plant life.
- Aquatic Ecosystem Disruption: Water bodies with a pH below 5.5 can become inhospitable to many fish and aquatic species, leading to biodiversity loss.
- Damage to Infrastructure: Acidic precipitation corrodes buildings, monuments, and vehicles—especially those made of limestone, marble, and metal.
- Forests and Vegetation: Trees and plants exposed to acid rain may experience leaf damage, reduced growth, and increased susceptibility to disease and harsh weather.
Acid rain serves as a powerful reminder of the intricate link between human activities, atmospheric chemistry, and environmental health. Understanding the pH scale, the mechanisms behind acid formation, and the impact of acidity on both living and non-living systems is crucial for implementing effective pollution control policies, advancing clean energy solutions, and protecting ecosystems for future generations.
Gases Contributing to Acid Rain and Their Origins:
Acidic Gases:
- Sulfur Oxides (SOx)
Origins:
- Combustion of fossil fuels, operation of thermal power stations.
- Extraction of metal from sulfide ores, various industrial activities, production of sulfuric acid.
- Natural origins include volcanic eruptions, marine environments, and the breakdown of organic materials.
Nitrogen Oxides (NOx: NO, NO₂, N₂O)
Origins:
- Burning of fossil fuels, combustion of biomass, wildfires, and power generation facilities.
- Natural origins encompass lightning strikes and activities in oceanic environments.
Chemical Reactions:
- Nitric oxide (NO) and nitrogen dioxide (NO₂) are generated under high temperature and pressure conditions, such as during combustion and lightning events.
- Nitrogen dioxide (NO₂) reacts with water present in precipitation to form nitric acid (HNO₃), which enriches soil with nitrates.
The Chemistry of Acid Rain:
- Sulfur and nitrogen oxides are released into the atmosphere from both natural and human-made sources.
- A portion of these oxides is deposited back to the Earth as dry deposition.
- Solar radiation promotes the creation of photo-oxidants, including ozone.
- These photo-oxidants interact with sulfur oxides, nitrogen oxides, and other gases (such as ammonia) to generate sulfuric acid (H₂SO₄) and nitric acid (HNO₃).
- These acids subsequently return to the Earth’s surface through wet deposition (in the form of rain, snow, fog, or mist) or dry deposition (as dust or smoke).
Forms of Deposition:
- Wet Deposition: Acidic substances are deposited as precipitation (rain, snow, fog), accumulating on plants and various surfaces.
- Dry Deposition: In arid conditions, acidic substances cling to dust or smoke particles, settling on surfaces such as vegetation, buildings, and vehicles.
This process accounts for roughly 50% of the atmospheric acidity that returns to the Earth’s surface.
Harmful Effects and Control of Acid Rain:
Effects on Soil:
- Nutrient Leaching: The exchange of hydrogen ions with nutrient cations, such as potassium and magnesium, results in decreased soil fertility.
- Reduced Decomposition: Elevated levels of ammonia disrupt nutrient balance and hinder decomposition processes, leading to lower nitrate concentrations.
- Buffering Capacity in India: The predominantly alkaline nature of Indian soils offers a degree of protection against the detrimental effects of acid rain.
Effects on Humans:
- Irritation and Chronic Conditions: Exposure can lead to irritation of the skin, eyes, and respiratory system, as well as chronic health issues such as bronchitis, emphysema, and cancer.
- Visibility Reduction: This phenomenon results in unpleasant odors and a decrease in visibility.
Effects on Aquatic Life:
- Impact on Gametes: Acid rain is lethal to the eggs and sperm of aquatic species, thereby disrupting their life cycles and the overall ecosystem.
- Microbial Decline: Acidification of lakes negatively affects microbial populations, rendering them less productive.
- Metal Contamination: The leaching of metals from soil into aquatic systems poses significant risks to aquatic habitats.
Effects on Terrestrial Life:
- Plant Damage: Acid rain damages the cuticles of leaves, which in turn diminishes photosynthetic efficiency.
- Heavy Metal Leaching: It facilitates the leaching of harmful metals such as aluminum, lead, and mercury, adversely affecting both soil organisms and plant life.
Effects on Microorganisms:
- pH Sensitivity: Bacteria and protozoa flourish in near-neutral pH, while fungi prefer acidic conditions, and blue-green bacteria thrive in alkaline environments.
- The presence of acid rain alters microbial communities, which can delay the decomposition of organic matter.
Effects on Buildings and Monuments:
- Material Erosion: Acidic fumes cause the dissolution of limestone and marble, leading to surface flaking.
- For instance, acid rain has resulted in “Marble Cancer” in iconic structures like the Taj Mahal.
Acid Rain-Prone Areas
- Global Concentration: Regions with high industrial activity, including Scandinavia, Canada, Japan, the Northeastern United States, and Northwestern Europe, are particularly affected.
- In India: The first recorded instance occurred in Bombay in 1974, with acid rain also noted in major urban areas and regions characterized by low soil pH, such as Northeast India, coastal Karnataka, and Kerala.
Control Measures
- Low Sulfur Fuels: The implementation of washed coal in thermal.
- Buffering involves the process of neutralizing acidified water through the application of lime, which can be in the form of calcium oxide or calcium carbonate.
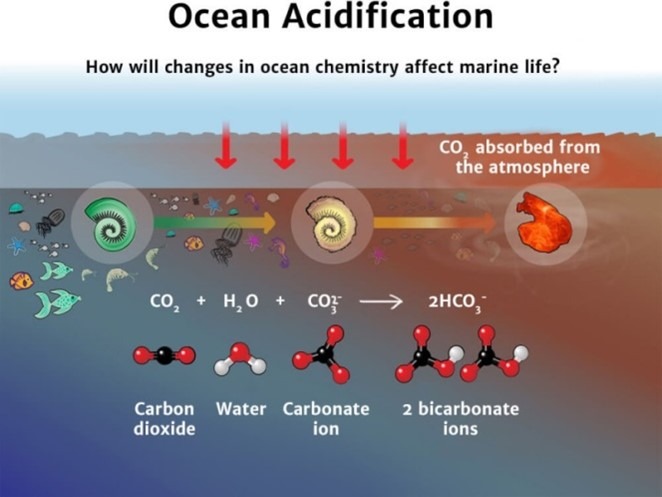
Ocean Acidification:
Ocean Acidification refers to the reduction in the pH levels of the Earth’s oceans, which typically hover around an alkaline value of approximately 8.1. This phenomenon is primarily driven by the absorption of carbon dioxide (CO₂) from the atmosphere and is often referred to as the “evil twin of global warming.”
Mechanism:
CO₂ Absorption: Approximately 30-40% of human-generated CO₂ is absorbed by oceans, rivers, and lakes. This gas reacts with water to produce carbonic acid, which subsequently dissociates into bicarbonate ions and hydronium ions (H⁺), resulting in increased acidity.
Other Contributors:
- Eutrophication: The decomposition of plankton blooms leads to a decrease in oxygen levels and an increase in CO₂, which further lowers pH.
- Arctic Ice Melting: The melting of ice exposes seawater to greater CO₂ absorption, which dilutes carbonate ions and raises CO₂ concentrations at the surface, exacerbating the decline in pH.
Effects of Ocean Acidification:
- Reduced Buffering Capacity: While oceans absorb about one-third of anthropogenic CO₂, the rising acidity is outpacing the natural buffering capacity, leading to diminished metabolic rates and weakened immune responses in various marine organisms.
Impact on Marine Calcifying Organisms:
- The reduction in carbonate ions impedes the formation of calcium carbonate in corals and plankton, resulting in coral bleaching and posing a threat to fisheries. Calcifying organisms play a vital role in marine food webs.
Cloud Formation Disruption:
- Phytoplankton in the oceans release dimethylsulfide (DMS), which is essential for cloud formation. Acidified waters lead to a decrease in DMS production, resulting in fewer clouds and elevated temperatures.
Control Measures:
- The primary approach to address ocean acidification involves reducing emissions of carbon monoxide (CO) and carbon dioxide (CO₂).
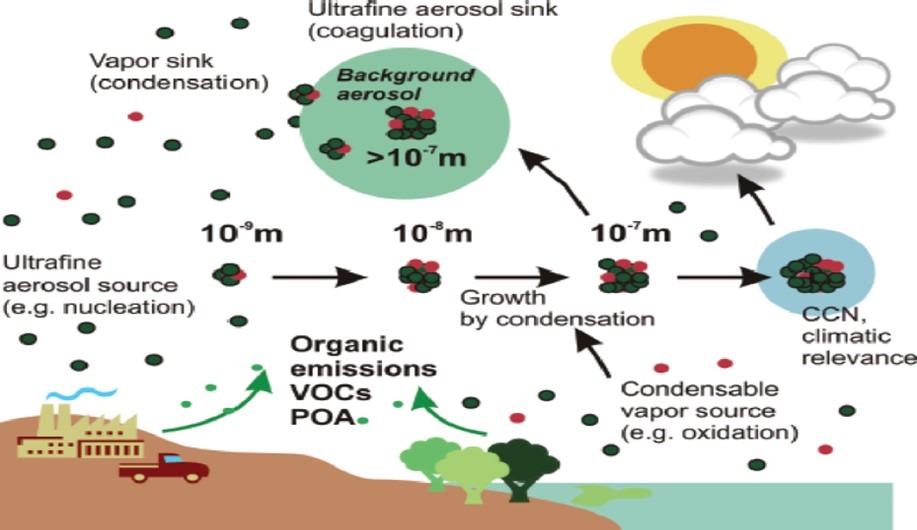
Aerosols and their Impact on Monsoon Rainfall:
A suspension of minute solid particles or liquid droplets within air or gas.
Classification:
- Natural: Includes phenomena such as fog, mist, dust, forest emissions, and steam from geysers.
- Anthropogenic: Comprises particulate pollutants and smoke.
- Function: Serve as nuclei for the formation of cloud droplets or ice crystals, thereby affecting cloud development.
Aerosols in the Atmosphere:
- Predominantly located in the lower atmosphere (less than 1.5 km) due to sources originating from the Earth’s surface.
- Volcanic aerosols can ascend to the stratosphere as a result of high-altitude eruptions.
Influence on Monsoon Rainfall
- Himalayan Region: Elevated levels of aerosols (including black carbon and dust) are associated with an increase in rainfall events, attributed to orographic lifting (the upward movement of air masses caused by topographical changes).
- Notable variations in rainfall distribution across the region have been recorded.
Impact on Climate and Monsoons:
- Aerosols can scatter or absorb solar radiation, altering the characteristics and longevity of clouds.
- Their influence on the Indian summer monsoon rainfall can be either positive or negative, depending on the duration and scale of aerosol presence.
- The cooling effect of smog diminishes the temperature gradient between land and sea, thereby disrupting the monsoon circulation from ocean to land.
Asian Tropopause Aerosol Layer (ATAL) and Its Influence on Monsoons:
- ATAL Formation: The formation of ATAL is attributed to the convective movement of aerosols from the lower atmosphere to the Upper Troposphere and Lower Stratosphere (UTLS, 12–18 km) during the monsoon season in South Asia.
- Composition: The layer is comprised of sulphates, black carbon, organic aerosols, nitrates, and dust particles.
Sources:
- Black Carbon: This component is transported from North India and East China, particularly during El Niño events.
- Sulphate Aerosols: These aerosols are primarily transported from East Asia.
Impact on Monsoon Precipitation:
- Cooling Effect: Elevated concentrations of sulphate aerosols lead to the scattering of solar radiation, resulting in a cooling effect on the Earth’s surface, which in turn disrupts the monsoon system.
- El Niño and Rainfall Reduction: The occurrence of El Niño is associated with a decrease in rainfall across India, a reduction that is exacerbated by aerosols, contributing to a 17% decline in precipitation over central India.
Impact on Regional Rainfall Patterns:
- Urban and Rural Disparities: Increased aerosol concentrations are linked to a rise in high-rainfall events in urban areas, while simultaneously causing rainfall shortages in rural regions.
Ozone Depletion:
The volume of ozone in the Earth’s stratosphere is consistently declining, with a more pronounced reduction observed in polar areas.
- Causes: The formation of Polar Stratospheric Clouds (PSCs) is driven by polar vortexes and low temperatures, which interact with ozone-depleting substances (ODS) such as chlorofluorocarbons (CFCs), leading to the degradation of ozone.
Ozone Depletion Areas:
- Antarctic Region: This region is characterized by a robust polar vortex, resulting in the formation of significant ozone holes.
- Arctic Region: In contrast, the Arctic experiences a relatively weaker polar vortex and elevated temperatures, leading to smaller and less frequent ozone holes.
Halocarbons and Their Role in Ozone Depletion:
- Halocarbons: These are chemical compounds formed when hydrogen atoms in hydrocarbons are substituted with halogens, including fluorine, chlorine, bromine, and iodine
- Photodissociation: The action of sunlight breaks down halocarbon-based ODS (such as CFCs, HCFCs, carbon tetrachloride, and halons), releasing chlorine atoms that contribute to ozone destruction.
Polar Vortex and Polar Stratospheric Clouds (PSCs):
Polar Vortex:
- This phenomenon is a polar cyclone that can extend up to 2,000 kilometers in diameter and reach into the lower stratosphere (8–9 kilometers at the poles).
- It facilitates the transport of halogens, which are instrumental in ozone depletion.
PSCs (Nacreous Clouds):
- These clouds form during winter at high altitudes (12–22 kilometers), predominantly at the South Pole.
- They are composed of water, nitric acid, and sulfuric acid.
- PSCs amplify chlorine-driven ozone depletion by transforming reservoir compounds into reactive radicals (Cl and ClO).
Accelerated Ozone Depletion:
The presence of PSCs significantly enhances the activity of halogen radicals, thereby exacerbating the destruction of the ozone layer, especially in polar regions.
Impact of Nanoparticles (NPs) on Hydroxyl Radicals (OH):
Hydroxyl radicals (OH) serve as a vital oxidizing agent in the troposphere and lower stratosphere, playing a key role in the degradation of ozone-depleting substances such as hydrochlorofluorocarbons (HCFCs).
Influence of NPs:
- Highly reactive nanoparticles interact with OH radicals, leading to a decrease in their availability.
- This decrease contributes to the sustained presence of ozone-depleting compounds in the atmosphere, thereby hindering the recovery of the ozone layer.
Tropical Ozone Hole:
- Discovery: A persistent ozone hole in the lower stratosphere over tropical regions has existed since the 1980s, although it has only recently been recognized.
Comparison with the Antarctic Ozone Hole:
- The tropical ozone hole is approximately seven times larger in area compared to its Antarctic counterpart.
- The depth of the tropical ozone hole is comparable to that of the Antarctic ozone hole.
- In contrast to the seasonal Antarctic ozone hole, the tropical ozone hole remains throughout the entire year.
Effects on Health:
Air Pollution Ranks as the Fourth Leading Cause of Death Worldwide:
- The ‘State of Global Air 2020’ report, published by the Health Effects Institute—an independent organization focused on global health and air pollution research—revealed that in 2019, both outdoor and indoor air pollution were responsible for over 1.67 million deaths in India, with 55% of these fatalities linked to outdoor pollution.
- India recorded the highest population-weighted annual average exposure to PM2.5 particles and ranked third in terms of population-weighted annual average exposure to ozone.
- On a global scale, air pollution was responsible for 6.67 million deaths in 2019, making it the fourth leading cause of mortality.
- Of these, 4.14 million deaths were attributed to outdoor exposure to PM2.5, while 2.31 million were linked to indoor air pollution.
Air Pollution and Occupational Health Risks:
- Compounds such as benzene, chromium, nitrosamines, and asbestos are linked to various cancers, including those affecting the lungs, bladder, skin, mesothelium, and liver.
- Occupational asthma arises from exposure to organic dust, microorganisms, bacteria, fungi, molds, and a range of chemicals.
- Silicosis, first identified in the Kolar gold mines in 1947, is prevalent among workers in mining and the pottery and ceramic sectors.
- Pneumoconiosis and byssinosis are frequently observed in workers from the mica and textile industries, respectively.
Black Lung Disease:
- Commonly referred to as black lung disease, pneumoconiosis or anthracosis is a respiratory condition affecting older coal industry workers.
- It results from the prolonged inhalation of small quantities of coal dust, which causes the lungs of miners to appear black rather than the normal healthy pink.
Prevention and Control of Air Pollution:
Control of Industrial Pollution:
Industrial pollution can be markedly diminished through the adoption of cleaner fuels, such as liquefied natural gas (LNG), in facilities like power and fertilizer plants. Additionally, the implementation of environmentally friendly industrial practices and the installation of various pollution control devices—such as filters, electrostatic precipitators, inertial collectors, scrubbers, gravel bed filters, and dry scrubbers—can significantly curtail the emission of harmful pollutants.
Filters:
- Filters are designed to eliminate particulate matter from gas streams.
- The Baghouse filtration system is the most prevalent type, constructed from either cotton or synthetic fibers for lower temperature applications, or glass cloth fabrics for higher temperature environments.
Electrostatic Precipitators (ESP):
- Electrostatic precipitators can effectively remove more than 99 percent of particulate matter from exhaust emissions. These devices are commonly utilized in boilers, furnaces, thermal power plants, cement manufacturing facilities, and steel production plants.
- The process of electrostatic precipitation involves charging the dust particles with ions, allowing the ionized particulate matter to be captured on a surface that has an opposite charge.
Working:
- An electrostatic precipitator operates with electrode wires that are energized to several thousand volts, creating a corona discharge that emits electrons.
- These electrons bond with dust particles, imparting a net negative charge to them. The collecting plates, which are grounded and thus possess a relatively positive charge, attract these charged dust particles.
- It is essential for the air velocity between the plates to be sufficiently low to facilitate the settling of dust. The collected particles are subsequently dislodged from the surface through periodic shaking or rapping.
Inertial Collectors:
- The inertia of suspended particulate matter (SPM) in gas is greater than that in its solvent.
- Since inertia is directly related to the mass of the particles, the device is more effective at capturing heavier particles, a process akin to centrifugation.
- A widely used inertial collector in gas cleaning applications is the ‘cyclone.’
Scrubbers:
- Scrubbers function as wet collectors, effectively eliminating aerosols from gas streams. They achieve this by either capturing wet particles on a surface or by moistening the particles with a scrubbing liquid.
- As the particles transition from the gaseous medium to the liquid scrubbing medium, they become trapped, akin to how mucus in the trachea captures dust. Scrubbers are capable of removing gases such as sulfur dioxide.
Catalytic Converter:
- Catalytic converters, which contain precious metals like platinum-palladium and rhodium as catalysts, are installed in vehicles to minimize the release of harmful gases.
- It is essential for vehicles equipped with catalytic converters to utilize unleaded petrol, as the lead present in regular petrol can deactivate the catalyst.
Functionality:
When exhaust gases flow through the catalytic converter, unburned hydrocarbons are transformed into carbon dioxide and water, while carbon monoxide and nitric oxide are converted into carbon dioxide and nitrogen gas, respectively.
Pollution Index to Control Industrial Pollution:
Polluted Industrial Areas (PIAs):
- Study Conducted: Central Pollution Control Board (CPCB) and State Pollution Control Board (SPCB) (2009–10).
- Criteria: Categorization based on Pollution Index (PI), which measures emissions, effluents, hazardous waste, and resource consumption.
Categories of Industrial Sectors:
Red Category:
- Pollution Index: Score 60+.
- Industries: Cement, petrochemicals, pharmaceuticals, sugar, paper and pulp, nuclear power plants, fertilizers, firecrackers, etc.
- Restrictions: Not allowed in ecologically fragile/protected areas.
Orange Category:
- Pollution Index: Score 41–59.
- Industries: Coal washeries, glass, paints, stone crushers, aluminium, copper extraction from scrap, etc.
Green Category:
- Pollution Index: Score 21–40.
- Industries: Aluminium utensils, steel furniture, soap manufacturing, tea processing, etc.
White Category:
- Pollution Index: Score ≤20.
- Industries: Air coolers, chalk factories, biscuit tray units, etc.
- Exemptions: No Environmental Clearance (EC) or Consent to Operate required—intimation to SPCB/CPCB suffices.
Significance:
- Encourages adoption of cleaner technologies and facilitates industry self-assessment.
- Enables authorities (e.g., NGT) to take timely action, such as ordering closures during critical pollution levels.
Coal Gasification:
- Gasification is a technological method that transforms carbonaceous materials, such as coal, into fuel gas, commonly referred to as synthesis gas (syngas) or producer gas, which consists primarily of carbon monoxide and hydrogen.
- Following a purification process, syngas can be utilized to generate synthetic natural gas (SNG, or methane, CH4) or liquid biofuels, including synthetic diesel.
- The gasification process takes place within a gasifier, typically a high-temperature (exceeding 700 °C) and high-pressure vessel, where coal is subjected to direct contact with oxygen and steam.
- This interaction initiates a series of thermochemical reactions, occurring without combustion, that convert the coal feedstock into syngas and residual ash or slag.
- Coal gasification represents one of the most environmentally friendly methods for converting coal into electricity, hydrogen, and other valuable energy products, thereby minimizing emissions of carbon monoxide, carbon dioxide, and sulfur dioxide.
- India has set an ambitious goal of achieving a coal gasification target of 100 million tons by 2030.
- In a similar vein, the gasification of waste materials lessens the demand for landfill space, curtails methane emissions, and diminishes reliance on fossil fuels.
Measures for Controlling Vehicular Pollution in India:
- Standards have been established to ensure the durability of catalytic converters, which play a crucial role in minimizing vehicular emissions.
- In metropolitan areas such as Delhi, vehicles are required to obtain a Pollution Under Control (PUC) certificate at regular intervals. This regulation guarantees that the emissions from vehicles remain within the legally mandated limits.
- The quality of fuel has seen significant enhancement, transitioning from BS-IV to BS-VI standards, which has reduced the allowable sulfur content from 50 Parts Per Million (ppm) in BS-IV to a maximum of 10 ppm in BS-VI compliant fuel.
- The previous practice of adding tetraethyl lead to petrol to enhance octane levels for smoother engine operation has been prohibited to eliminate the emission of lead particles.
- The use of alternative fuels, such as Compressed Natural Gas (CNG), has been mandated for public transport vehicles in cities like Delhi. By the end of 2002, all buses in Delhi were converted to operate on CNG.
- CNG is known for its efficient combustion in vehicles, resulting in minimal unburnt fuel, and it is more economical than petrol or diesel. Additionally, CNG is secure from theft and cannot be adulterated like traditional fuels.
- However, a significant challenge in transitioning to CNG lies in the complexity of establishing pipelines for distribution and ensuring a consistent supply.
- According to the Vehicle Scrappage Policy of 2021, all vehicles owned by central and state governments that have reached 15 years of age will be scrapped starting April 1, 2023.
- This policy also aims to de-register private cars older than 20 years and commercial vehicles exceeding 15 years of age.
Bharat Stage (BS) Norms:
- Objective: To control air pollutant emissions from motor vehicles through the use of suitable fuels and technologies.
- Implementation Schedule: Launched in 2000, with progressively stringent emission standards at advanced stages (e.g., BS VI).
Regulated Pollutants:
The norms address emissions of nitrogen oxides, carbon monoxide, hydrocarbons, particulate matter (PM), and sulfur oxides from internal combustion engines.
BS VI Norms:
- Mandatory nationwide implementation began on April 1, 2020, bypassing BS V to meet carbon footprint commitments.
- The Supreme Court prohibited the sale of BS IV vehicles from this date, although existing BS III and BS IV vehicles remain operational.
Comparison with European Standards:
- BS VI regulations align with European standards, specifically Euro 6.
- Benefits of BS VI Vehicles and Fuel
- Reduction in Emissions: For diesel vehicles, particulate matter emissions are reduced by 80%, and nitrogen oxides by 70%. For petrol vehicles, nitrogen oxides are decreased by 25%.
Technological Advancements:
- Improvements include more effective catalytic converters due to lower sulfur content, onboard diagnostics (OBD) for monitoring efficiency, and Real Driving Emissions (RDE) testing to assess performance under actual driving conditions.
- Additionally, particulate matter is quantified based on number standards rather than mass standards.
- Consequences: The transition to BS VI has led to increased costs associated with advanced technology and necessary infrastructure enhancements, resulting in higher prices for BS VI-compliant vehicles and fuel.
India’s UNFCCC Commitments (INDCs)
- Emission Intensity Targets: Aim to reduce GDP emissions intensity by 33–35% compared to 2005 levels by 2030.
- Non-Fossil Fuel Utilization: Target to elevate the share of electricity generated from non-fossil fuel sources to 40% by 2030.
- Forest Expansion: Plan to increase forest cover to sequester 2.5–3 billion tons of CO₂ by 2030.
Electric Mobility:
- Government Objectives: The goal is to achieve a complete transition to electric vehicles by 2030, although this commitment is not yet fully realized due to challenges related to infrastructure and financing.
- Emphasis is placed on two- and three-wheeled vehicles.
- The NITI Aayog has proposed a ban on internal combustion engine-powered two-wheelers by 2025 and three-wheelers by 2023.
EV Charging Guidelines to Encourage EV Adoption:
- To give a boost to EVs, Minister of Power has approved amendments in EV Charging Guidelines and Specifi cations.
- It has been envisaged that in the first phase (i.e. 1-3 years) all Mega Cities with population of 4 million plus, all existing highways connected to/connecting these Mega Cities will be covered, while in the second phase (3-5 years) big cities like State Capitals, UT headquarters may be covered.
- Bureau of Energy Efficiency (BEE), a statutory body under Ministry of Power (not MoEF) has been nom inated as the Central Nodal Agency.
Electric Vehicle Charging Guidelines and Specifications:
- At least one Charging Station in a grid of 3 x 3 Km in cities.
- A charging station at every 25 km and a fast charging station at every 100 kms on both sides of highways.
- Private charging at residences/offices managed by DISCOMs.
- The Public Charging Stations (PCS) to be a de-licensed activity (anyone can setup a PCS).
- Freedom to Public Charging Stations to install the chargers as per the market requirement.
Tax Incentives:
- The Finance Minister has introduced an additional income tax exemption of ₹5 lakh for buyers of electric vehicles in the Budget for 2019-2020.
- The GST Council has opted to lower the GST rate on electric vehicles from 12% to 5%, and on chargers or charging stations from 18% to 5%, in an effort to stimulate the electric vehicle market.
Skepticism Regarding the Adoption of Electric Mobility:
- The long-term environmental benefits associated with a global shift to electric vehicles remain uncertain.
- India ranks as the fourth largest automobile market globally, making the establishment of charging infrastructure to accommodate such a large market significantly more challenging than in Western nations.
- China possesses a strategic advantage in a widespread transition to electric vehicles due to its easy access to lithium and cobalt, as well as its production of low-cost, high-efficiency automobile batteries. In contrast, India will rely entirely on imports for these essential materials.
Challenges Facing the Automobile Industry:
- Recent declines in automotive sales can be attributed to the implementation of the Goods and Services Tax (GST). This issue is exacerbated by rising insurance premiums, elevated tax rates (28% GST on motorcycles up to 350cc and cars), soaring raw material costs, and fluctuating fuel prices.
- The sector has made substantial investments in transitioning from BS-IV to BS-VI (Euro VI) standards, establishing a robust infrastructure and workforce dedicated to the production and maintenance of internal combustion engine vehicles.
Will Electric Vehicles Mitigate Carbon Emissions?
- Given that 55% of electricity generation in India relies on coal, the overall reduction in carbon emissions may be minimal, even with widespread adoption of electric vehicles (EVs) in the country.
- Nonetheless, electric vehicles are expected to contribute to decreased pollution levels in urban areas, as 14 out of the 20 cities with the highest concentrations of harmful particulate matter (PM 2.5) are located in India.
Green Tax on Older Vehicles:
- The government has recently introduced a proposal for a ‘green tax’ targeting older petrol and diesel vehicles.
- This initiative is grounded in the principle that “polluters must pay,” and the tax will be applied when commercial vehicles seek new fitness certificates and when private vehicles apply for registration renewals.
- State governments would have the authority to impose this tax in addition to the standard road taxes. Presently, comparable taxes are implemented in Andhra Pradesh, Maharashtra, Karnataka, Telangana, Uttar Pradesh, and Jharkhand.
- The funds generated from the Green Tax will be allocated to a distinct account, designated for addressing pollution and enabling states to establish advanced facilities for monitoring emissions.
Proposed Tax Framework:
- A Green Tax ranging from 10% to 25% of the road tax may be imposed on transport vehicles that are over eight years old.
- Personal vehicles will incur a Green Tax after they reach 15 years of age.
- Public transport vehicles, including city buses, will be subject to a reduced Green Tax rate.
- A significantly higher Green Tax, equivalent to 50% of the road tax, will apply to vehicles registered in areas with high pollution levels.
- The tax structure will vary based on the type of fuel used (petrol or diesel) and the category of the vehicle.
- Exemptions will be granted for vehicles utilized in agriculture and those powered by clean fuels such as CNG, LPG, ethanol, and advanced hybrid technologies.
Polluter Pays Principle:
- The ‘polluter pays’ principle is a widely recognized concept asserting that those responsible for pollution should incur the expenses associated with its management to mitigate harm to public health and the environment.
- For example, a factory that generates a hazardous by-product during its operations is typically held accountable for its proper disposal.
- When the costs associated with greenhouse gas (GHG) emissions are not charged to the emitters, these expenses are effectively ‘externalized’ onto society, leading to what is termed ‘market failure.’ Consequently, society absorbs these costs as GHGs are released into the atmosphere, which is regarded as a ‘global commons’ that everyone shares and has the right to utilize.
- The polluter pays principle is integral to a broader framework of guidelines aimed at promoting sustainable development globally, as outlined in the 1992 Rio Declaration.
National Clean Air Program (NCAP):
- GOI launched NCAP in 2019 to reduce pollution levels (PM2.5 and PM10) by 40% by 2024 in cities, with 2017 as the base year for comparison.
- In 2022, GOI set a new target of 40% by 2026. (Acceptable annual standards for PM 2.5 is 40 μg/m3and PM 10 is 60 μg/m3)
- NCAP is the first national-level strategy to tackle the air pollution problem across the country compre hensively with a time-bound reduction target. It will be a mid-term, five-year action plan with 2019 as the first year. It takes inspiration from how Beijing has succeeded in reducing PM2.5 by 33.3 per cent in five years.
- The NCAP is working on expanding the national air quality monitoring network, building capacity for air pollution management, and strengthening public awareness about the dangers of air pollution. It covers 132 non-attainment cities (cities that have fallen short of the National Ambient Air Quality Standards for over five years) which were identified by the Central Pollution Control Board (CPCB).
- “PRANA” – Portal for Regulation of Air-pollution in Non-Attainment cities, is a portal for monitoring the implementation of NCAP.
NGT Critiques NCAP Initiative:
- The National Clean Air Programme (NCAP) encompasses 131 cities classified as non-attainment across 23 states and Union Territories, as identified by the Central Pollution Control Board (CPCB) based on ambient air quality data from 2011 to 2015.
- Non-attainment cities are defined as those where air quality standards were not consistently met over a five-year period.
- The National Green Tribunal (NGT) asserted that the Ministry of Environment, Forest and Climate Change’s (MoEF) strategy contravenes Article 21 of the Constitution.
- The right to clean air is recognized as an integral part of the right to life, and neglecting air pollution constitutes a violation of this right. Furthermore, the NGT emphasized that the principles of sustainable development and the public trust doctrine necessitate the implementation of rigorous measures.
- The NCAP aims to meet air quality standards within a decade, targeting a 35% reduction in pollution levels during the initial three years, followed by additional reductions thereafter.
- This implies that for a ten-year duration, air pollution issues would remain inadequately addressed, which is an excessively long period to tolerate violations, especially when clean air is fundamental to the right to life.
Additional Critiques of the NCAP:
- The National Clean Air Program (NCAP) functions primarily as a collaborative and participatory initiative. The Central Pollution Control Board (CPCB) is responsible for implementing the program in alignment with the Air (Prevention and Control of Pollution) Act of 1986.
- However, there is ambiguity regarding the specific pollutants targeted for reduction, or whether all pollutants will be addressed. Furthermore, the program lacks formal notification under any legislative framework, which undermines its legal authority.
- The 11th and 12th Five-Year Plans incorporated the NCAP strategy to enhance air quality in major cities in accordance with the National Ambient Air Quality Standards. Nevertheless, this initiative failed to gain traction due to the absence of a definitive legal framework and insufficient funding.
National Air Quality Monitoring Programme:
- The Central Pollution Control Board (CPCB) has been implementing a comprehensive national initiative for monitoring ambient air quality, referred to as the National Air Quality Monitoring Programme (NAMP).
- This network comprises 804 operational stations that span 344 cities and towns across 28 states and 6 Union Territories in India.
- The objectives of NAMP include assessing the current status and trends of ambient air quality, ensuring adherence to National Ambient Air Quality Standards (NAAQS), identifying cities that do not meet these standards, understanding the natural atmospheric cleansing processes, and facilitating both preventive and corrective actions.
- Within the framework of NAMP, four specific air pollutants—Sulphur Dioxide (SO2), Nitrogen Oxides (NO2), Respirable Suspended Particulate Matter (RSPM/PM10), and Fine Particulate Matter (PM2.5)—are consistently monitored at all sites.
- Additionally, parameters such as wind speed, wind direction, relative humidity (RH), and temperature are incorporated into the air quality monitoring process.
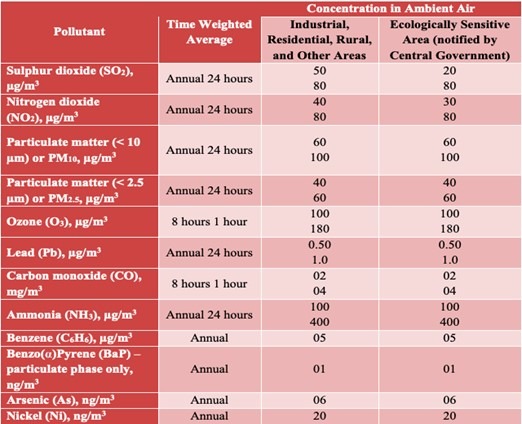
National Ambient Air Quality Standards (NAAQS):
The National Ambient Air Quality Standards (NAAQS) are established by the Central Pollution Control Board (CPCB) and are enforced nationwide. This authority has been granted to the CPCB under the Air (Prevention and Control of Pollution) Act of 1981.
Pollutants Under National Ambient Air Quality Standards:
SAFAR System for Monitoring Air Pollutants:
- The System of Air Quality and Weather Forecasting and Research (SAFAR) represents a national initiative established by the Ministry of Earth Sciences (MoES), distinct from the Ministry of Environment and Forests (MoEF).
- This system is a crucial component of India’s inaugural Air Quality Early Warning System, which is currently operational in Delhi.
- SAFAR is designed to assess the air quality within metropolitan areas while simultaneously tracking various meteorological parameters, including temperature, precipitation, humidity, wind speed, wind direction, ultraviolet radiation, and solar radiation.
- The network comprises numerous air quality monitoring stations across each city, all equipped with real-time, continuous monitoring devices for a range of pollutants.
- The system is indigenously developed by the Indian Institute of Tropical Meteorology (IITM), Pune and is operationalised by the India Meteorological Department (IMD).
- It has a giant colour LED display that gives out real-time air quality index on a 24×7 basis with colour-coding (along with 72 hours advance fore cast).
- The ultimate objective of the project is to increase awareness among the public regarding the air quality in their city.
Pollutants monitored under SAFAR System include:
- PM2.5,
- PM10,
- Ozone,
- Carbon Monoxide (CO),
- Nitrogen Oxides (NOx),
- Sulphur Dioxide (SO2),
- Benzene (found in crude oil. It is used to make plastics, resins, synthetic fibres, rubber lubricants, etc. As a VOC, benzene reacts with other air pollutants to form ground-level ozone which can damage crops (in the form of smog) and materials),
- Toluene (methylbenzene — used in paint thinners & as octane booster in gasoline engines),
- Xylene (dimethylbenzene — used as a solvent in printing, rubber, and leather industry), and
- Mercury.
2021 WHO Air Quality Guidelines (AQGs):
The World Health Organization (WHO) has published a revised edition of the Global Air Quality Guidelines (AQGs), which now take into account the detrimental effects of air pollution on human health at concentrations previously deemed safe.
The recently established air quality guidelines indicate that a significant portion of India is likely to be classified as a polluted area for the majority of the year. It is important to note that the World Health Organization’s guidelines are not legally enforceable and do not have an immediate effect on India, as the National Ambient Air Quality Standards do not align with the current WHO standards.
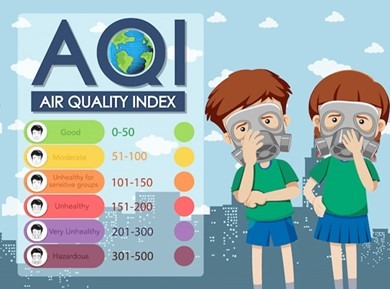
National Air Quality Index (AQI):
- The Air Quality Index (AQI) was introduced by the Ministry of Environment and Forests (MoEF) in April 2015 as part of the ‘Swachh Bharat’ initiative.
- This index enables citizens to assess the air quality in their local environment.
- The AQI is divided into six categories: Good, Satisfactory, Moderately Polluted, Poor, Very Poor, and Severe.
- It evaluates the presence of eight pollutants, which include PM10, PM2.5, NO2, SO2, CO, O3, NH3, and lead (Pb).
Measures to Control Air Pollution in NCR:
- The Environment Pollution (Prevention and Control) Authority, established by the Supreme Court, was officially notified in 1998 by the Ministry of Environment and Forests under the Environment Protection Act of 1986.
- Initially tasked with transitioning Delhi’s bus and auto fleet to compressed natural gas (CNG), its current responsibilities include the prevention and control of environmental pollution in the National Capital Region, as well as the enforcement of the Graded Response Action Plan (GRAP).
Graded Response Action Plan (GRAP):
- The Graded Response Action Plan (GRAP) functions solely as a contingency strategy. Consequently, it does not encompass actions by various state governments to address industrial, vehicular, and combustion emissions throughout the year.
- The plan is designed to be incremental; thus, when air quality deteriorates from ‘Poor’ to ‘Very Poor’, the prescribed measures in both sections must be enacted.
GRAP has achieved two significant milestones that were previously unaccomplished:
1) it has established a systematic approach for the entire Delhi-NCR region, and
2) it has successfully engaged multiple agencies, including all pollution control boards, authorities of industrial zones, municipal corporations, and regional representatives from the India Meteorological Department, among others.
- The implementation of the plan necessitates collaboration and action among 13 distinct agencies across Delhi, Uttar Pradesh, Haryana, and Rajasthan (NCR regions).
- Prior to the execution of any measures, the Environment Pollution (Prevention and Control) Authority (EPCA) convenes a meeting with delegates from all NCR states.
Measures Implemented Under GRAP:
In cases of Severe+ or Emergency (PM 2.5 levels exceeding 300 µg/m3 or PM10 levels surpassing 500 µg/m3 for over 48 hours),
The following actions are mandated:
- prohibition of truck entry (with exceptions for essential goods),
- cessation of construction activities, and
- the implementation of an odd/even vehicle usage scheme.
For Severe conditions (PM 2.5 > 250 µg/m3 or PM10 > 430 µg/m3),
- It is required to shut down brick kilns,
- hot mix plants, and
- stone crushers,
- maximize power generation from natural gas to minimize coal usage, and conduct mechanized road cleaning along with water sprinkling.
In Very Poor air quality (PM2.5 > 120 µg/m3 or PM10 > 350 µg/m3),
- the use of diesel generators must be halted, and
- residents of apartments should be encouraged to refrain from burning fires during winter.
For Poor air quality (PM2.5 > 60 µg/m3 or PM10 > 100 µg/m3),
- heavy penalties will be imposed for burning garbage, and
- strict enforcement of pollution control regulations in brick kilns and industries will be necessary, alongside mechanized road sweeping and water sprinkling, and
- a stringent ban on firecrackers will be enforced.
Additional initiatives include:
- the National Green Tribunal has mandated a prohibition on older vehicles operating within the city;
- significant reductions in open burning practices have been achieved; and
- the eastern and western peripheral expressways have been finalized to accommodate vehicles not intended for entry into Delhi.
Has GRAP Been Effective?
- The implementation of GRAP has proven beneficial, particularly in enhancing accountability and establishing deadlines.
- Each action associated with a specific air quality category is assigned to designated executing agencies, which facilitates coordination among 13 agencies across four states due to the clear delineation of responsibilities.
- Notably, three significant policy decisions attributed to EPCA and GRAP include the shutdown of the Badarpur thermal power plant, the timely introduction of BS-VI fuel in Delhi ahead of the originally scheduled deadline, and the prohibition of Peat coke as a fuel in the Delhi-NCR region.
Measures to Reduce Stubble Burning:
PUSA Decomposer:
- The PUSA Decomposer, developed by researchers at the Indian Council of Agricultural Research (ICAR) Indian Agriculture Research Institute (IARI), is a novel solution aimed at accelerating the decomposition of agricultural stubble in the national capital and its surrounding regions.
- Each capsule of this fungal solution can produce 25 liters of a liquid mixture. Farmers are required to combine this liquid with jaggery and gram flour before applying it to the stubble, facilitating its bio-degradation within a span of 20 days.
Super SMS and Happy Seeders:
The government of Punjab has supplied over 50,000 subsidized stubble management machines. The Super Stubble Management Systems (Super SMS) facilitate the chopping and even distribution of stubble. Additionally, the Happy Seeder enables the direct sowing of wheat without the need to clear the stubble.
Smog Towers:
- In 2020, the Supreme Court instructed the government to devise a strategy for the installation of ‘smog towers’ throughout the capital to combat air pollution.
- These towers are engineered to function as extensive air purification systems, equipped with several layers of carbon nanofiber filters that remove pollutants from the air as it flows through them.
- Additionally, the Supreme Court mandated that anti-smog guns must be a requisite in projects seeking environmental clearance (EC) that encompass a built-up area exceeding 20,000 square meters.
Emissions Trading Scheme (ETS) by Gujarat:
- The government of Gujarat has introduced an Emissions Trading Scheme (ETS) specifically for the trading of particulate matter emissions.
- Although various trading mechanisms for pollution control are in place, none have been established for particulate matter emissions.
- For instance, the Clean Development Mechanism (CDM) under the Kyoto Protocol facilitates the trading of ‘carbon credits’; the European Union’s Emission Trading System addresses greenhouse gas emissions; and India operates a scheme through the Bureau of Energy Efficiency that permits trading in energy units.
- Initiated in Surat, the ETS aims not only to reduce pollution levels but also to lower compliance costs for industries.
The functioning of the Emissions Trading Scheme (ETS):
- It involves the Gujarat Pollution Control Board (GPCB) setting a limit on the total emissions allowed for all industries.
- Industries can then trade permits, which represent the right to emit a certain amount of particulate matter (measured in kilograms), within this established cap.
- This system is often referred to as a cap-and-trade market, as it provides industries with the opportunity to delay compliance while investing in cleaner technologies.
- Surat was selected for this scheme due to its significant pollution challenges and the fact that local industries have already implemented Continuous Emission Monitoring Systems, enabling accurate measurement of particulate matter emissions.
Other Measures:
Pradhan Mantri Ujjwala Yojana:
- In 2015, the concentration of fine particulate matter in India’s air pollution was recorded at 55 µg/m3, with New Delhi frequently exceeding 300 µg/m3.
- Transitioning from biomass to cleaner fuels such as LPG could reduce the national average annual air pollution to 38 µg/m3, which is slightly below the National Ambient Air Quality standard of 40 µg/m3 and significantly above the WHO guideline of 10 µg/m3.
- Furthermore, in 2016, the Ministry of Petroleum & Natural Gas launched the Pradhan Mantri Ujjwala Yojana to provide LPG connections to women from Below Poverty Line (BPL) households.
- As a result, the usage of LPG cylinders has increased to 89% of households in India, up from 56.2% on April 1, 2015.
Green Crackers:
- In 2019, the Supreme Court mandated the adoption of environmentally friendly crackers for the Diwali festival.
- Historically, firecrackers, with 90% of India’s production originating from Sivakasi, Tamil Nadu, were manufactured using barium nitrate, antimony, and various metals.
- The Supreme Court prohibited the use of barium nitrate due to its significant contribution to pollution from these products.
- The National Environmental Engineering Research Institute (NEERI), which operates under the Council of Scientific and Industrial Research (CSIR), was tasked with promoting the creation of green crackers.
- NEERI replaced barium nitrate with potassium nitrate and zeolite, achieving a reduction in particulate matter (PM10 and PM2.5) by 30%.
Government Initiatives to Reduce SO2 emissions:
In 2015, the Ministry of Environment and Forests established limits on sulfur dioxide emissions for coal-fired power plants. The original deadline for the installation of flue-gas desulfurization systems was set for 2022, but this has now been extended by an additional two years.
Flue-Gas Desulfurization (FGD) systems:
- Flue Gas Desulfurization (FGD) systems can utilize either wet or dry scrubbing methods to eliminate acidic gases, specifically sulfur dioxide (SO2) and hydrochloric acid (HCl), from exhaust emissions.
- Both methods incorporate lime as a key component.
- In wet FGD systems, flue gases interact with a liquid or solid slurry absorbent, leading to the dissolution or reaction of sulfur dioxide with the absorbent, resulting in the formation of wet calcium sulfite.
- This sulfite can subsequently be transformed into gypsum, which is utilized in cement manufacturing.
- Conversely, dry FGD scrubbing involves the direct injection of lime into the flue gas stream to effectively remove SO2 and HCl from low-sulfur fuel sources.
