Food Chain:
A food chain is a linear sequence of organisms in which energy is transferred through feeding relationships. It begins with producers (organisms that synthesize their own food) and progresses through various levels of consumers, ultimately culminating in apex predators. This process plays a crucial role in energy flow and nutrient cycling, ensuring the balance and stability of ecosystems.
Energy Transfer in the Food Chain
The foundation of every food chain lies in the conversion of solar energy into chemical energy through photosynthesis. Plants, algae, and certain bacteria act as primary producers, harnessing sunlight to create organic compounds. These organic compounds serve as food for primary consumers (herbivores), which are then consumed by secondary and tertiary consumers (carnivores and omnivores). This transfer of energy continues until it reaches the highest trophic level, occupied by apex predators, which have no natural predators of their own.
At each step of the food chain, energy is lost as heat due to metabolic processes, making the transfer of energy less efficient as it moves up the trophic levels.
Types of Food Chains
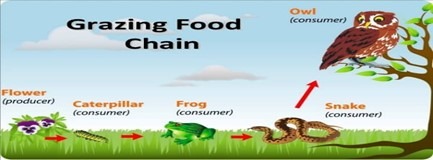
1. Grazing Food Chain: Energy Flow from Plants to Carnivores
The grazing food chain is the most common type, beginning with green plants as primary producers and herbivores as primary consumers. It is the primary pathway through which solar energy enters an ecosystem. This type of food chain is found in both terrestrial and aquatic ecosystems.
Examples of Grazing Food Chains:
Terrestrial Ecosystem:
- Grass → Caterpillar → Lizard → Snake
- Grass absorbs sunlight and converts it into food. Caterpillars feed on grass, providing energy for lizards, which in turn are consumed by snakes.
Aquatic Ecosystem:
- Phytoplankton → Zooplankton → Small Fish → Large Fish → Pelican
- Microscopic phytoplankton (primary producers) are eaten by zooplankton, which are consumed by small fish. Larger fish feed on the smaller ones, and finally, pelicans prey on large fish.
The grazing food chain plays a vital role in maintaining the stability of ecosystems by regulating population sizes at each trophic level and ensuring a steady flow of energy.
Significance of the Food Chain
- Maintains Ecological Balance: The interaction of species within a food chain helps regulate population dynamics, preventing overpopulation or extinction.
- Supports Energy Flow: Energy is transferred from lower to higher trophic levels, fueling biological processes across ecosystems.
- Nutrient Recycling: Dead organisms decompose, returning essential nutrients to the environment for recycling in the ecosystem.
- Ecosystem Interconnectivity: Food chains interconnect to form food webs, ensuring stability and resilience against environmental changes.
By understanding food chains and their components, ecologists can preserve biodiversity, manage ecosystems efficiently, and mitigate human-induced disruptions, such as habitat destruction and pollution.
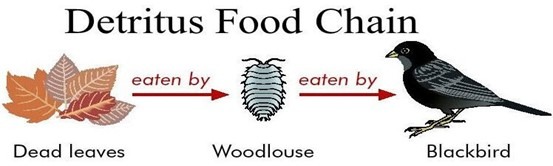
2. Detritus food chain:
The detritus food chain (DFC) is a crucial component of ecosystem functioning, responsible for breaking down dead organic matter and returning essential nutrients to the environment. Unlike the grazing food chain, which relies on living plant biomass as its energy source, the detritus food chain derives energy from decomposing plant and animal material, ensuring the continuous cycling of organic matter. This process plays a vital role in nutrient recycling and maintains soil fertility, making it indispensable for ecosystem stability.
Energy Flow in the Detritus Food Chain
The detritus food chain begins with dead plant material, animal carcasses, and organic waste. These materials are broken down by decomposers and detritivores, which extract the remaining energy and convert complex organic compounds into simpler substances. This breakdown releases essential nutrients back into the environment, making them available for primary producers.
Key Components of the Detritus Food Chain:
1. Detritus (Dead Organic Matter) – The starting point of the detritus food chain, consisting of fallen leaves, decaying plants, animal remains, fecal matter, and other organic waste.
2. Microorganisms (Decomposers) – Bacteria and fungi decompose dead material by breaking it down into simpler compounds, such as carbon, nitrogen, and phosphorus. These nutrients enrich the soil, promoting plant growth.
3. Detritivores (Scavengers) – Organisms like earthworms, millipedes, woodlice, and certain insects feed on decaying organic matter, accelerating the decomposition process.
4. Secondary Consumers (Small Predators) – Organisms such as frogs, birds, and rodents feed on detritivores, forming a link between decomposition and higher trophic levels.
5. Tertiary Consumers (Larger Predators) – Larger predators like chickens, hawks, and foxes feed on secondary consumers, completing the detritus food chain.
How the Detritus and Grazing Food Chains are Connected
Although the detritus food chain and grazing food chain function separately, they are interconnected, ensuring a continuous flow of energy and nutrients throughout the ecosystem. Decomposers play a significant role in breaking down organic matter into simpler compounds, which are then absorbed by plants, reintroducing essential nutrients into the grazing food chain.
For example:
- Dead plants and animals decompose, providing organic nutrients that enhance soil fertility.
- These nutrients are absorbed by plants, which serve as producers in the grazing food chain.
- This interconnection ensures that no energy is wasted, as organic matter is recycled and reused within the ecosystem.
Importance of the Detritus Food Chain
- Recycles Nutrients – Converts dead organic material into essential nutrients, enriching soil and sustaining plant growth.
- Maintains Soil Fertility – Organic decomposition enhances soil structure, aeration, and nutrient availability, promoting a healthier ecosystem.
- Regulates Ecosystem Balance – Prevents the accumulation of dead matter and waste, reducing the risk of disease outbreaks.
- Supports Food Webs – The energy derived from decaying organic matter sustains numerous species, from microorganisms to top predators.
- Enhances Carbon Cycling – Decomposers break down organic carbon, facilitating its return to the environment in the form of carbon dioxide.
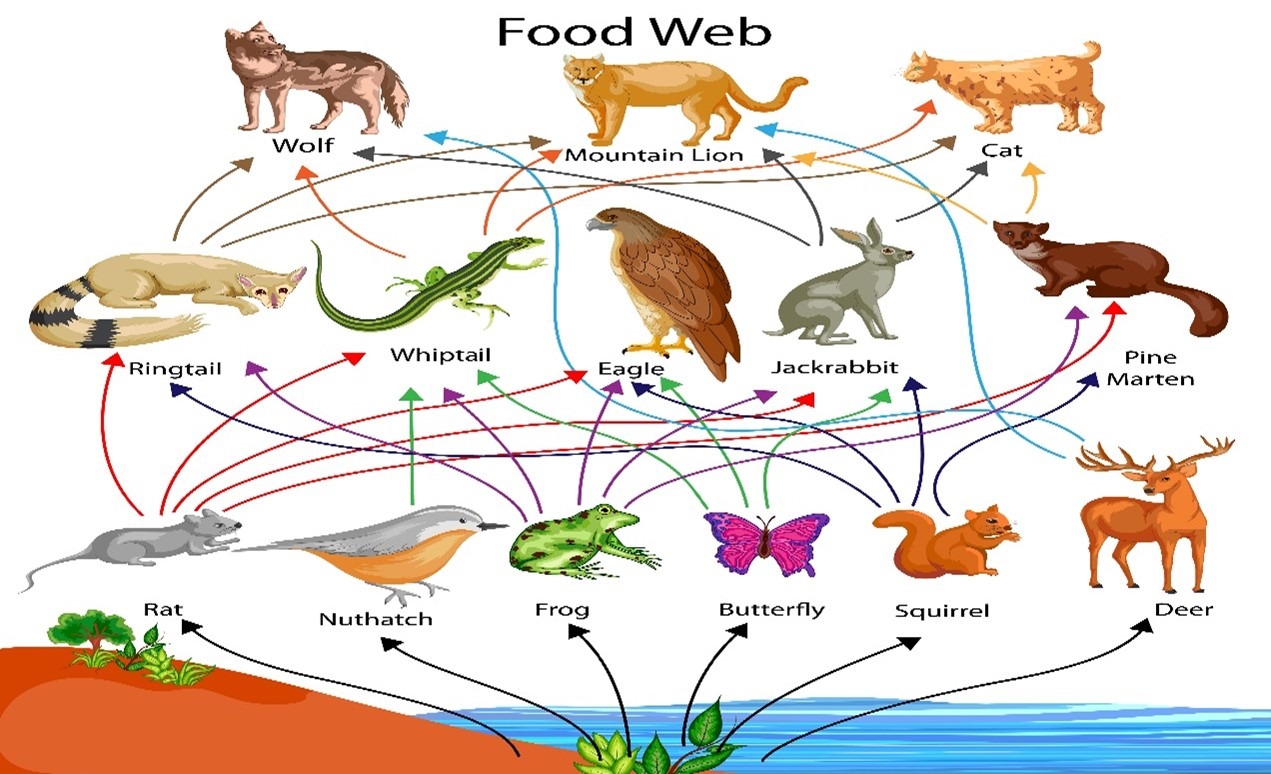
Food Web:
In ecological systems, organisms are connected through intricate feeding relationships that determine the flow of energy and nutrients. While a food chain represents a simple, linear sequence of energy transfer from producers to consumers, a food web illustrates a complex network of interconnected food chains. These interdependencies ensure the survival and stability of ecosystems, allowing species to adapt to changing conditions and resource availability.
Food Chains: A Single Energy Pathway
A food chain is a straightforward representation of energy transfer within an ecosystem, showing how each organism depends on the one before it for food. It begins with producers (plants and algae), which capture sunlight and convert it into chemical energy. This energy is then transferred to herbivores (primary consumers), carnivores (secondary and tertiary consumers), and finally apex predators.
Example of a Food Chain:
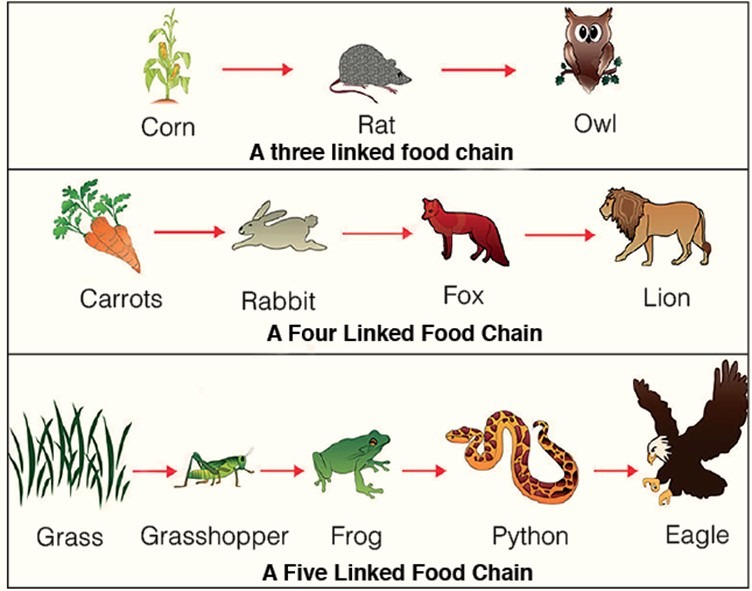
- Grass → Grasshopper → Frog → Snake → Eagle (Terrestrial Ecosystem)
- Phytoplankton → Zooplankton → Small Fish → Big Fish → Shark (Aquatic Ecosystem)
While food chains help simplify the understanding of who eats whom, they do not fully represent the diverse feeding relationships found in nature.
Food Webs: A Complex Network of Interconnected Chains
In reality, ecosystems are not made up of isolated food chains. Instead, they consist of multiple overlapping food chains, forming a food web. A food web more accurately represents the interconnections and alternative energy pathways within an ecosystem.
How Food Webs Work:
- A single food source (e.g., grass) may serve as food for multiple herbivores, such as rabbits, grasshoppers, goats, and cows.
- Herbivores, in turn, become prey for various carnivores, such as foxes, owls, snakes, and big cats.
- Seasonal changes influence food preferences—watermelon in summer and peaches in winter, showcasing the adaptability of organisms.
- If a species in one food chain goes extinct or declines, the food web provides alternative food sources, ensuring the stability and survival of organisms.
Example of a Food Web:
In a grassland ecosystem, a food web may include:
- Grass → Grasshopper → Frog → Snake → Hawk
- Grass → Rabbit → Fox → Eagle
- Grass → Cow → Humans
- Small Fish → Large Fish → Pelican
Since multiple organisms can feed on the same resource, food webs allow ecosystems to remain resilient in the face of disturbances like climate change, disease outbreaks, or habitat destruction.
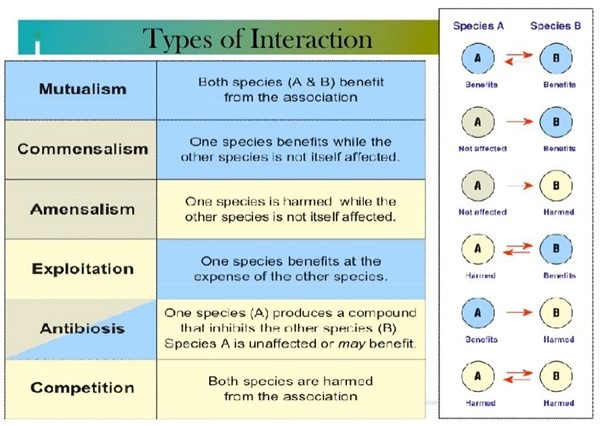
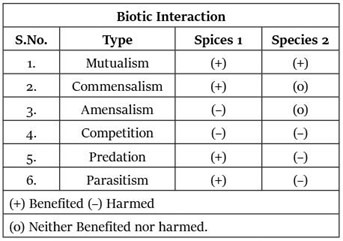
- Biotic interactions are the fundamental relationships between organisms that drive the functioning and stability of ecosystems. These interactions shape species’ survival, reproduction, and distribution, and they influence energy flow and nutrient cycling within the ecosystem. In the context of a food web, these interactions are classified into several types, each of which plays a distinct role in the ecological balance of the environment. Below are the main categories of biotic interactions:
1. Mutualism: A Relationship of Mutual Benefit
- In a mutualistic interaction, both species involved benefit from the relationship, often in ways that enhance their survival, growth, or reproduction. This type of interaction is critical for promoting biodiversity and maintaining ecosystem functionality.
Example of Mutualism:
- Pollination: Bees and flowering plants engage in mutualism. Bees obtain nectar from flowers for food, while simultaneously pollinating the plants, enabling them to reproduce.
- Mycorrhizal Fungi and Plants: Fungi attach to the roots of plants, improving their nutrient absorption, while the plants provide the fungi with organic carbon from photosynthesis.
- Mutualism is often seen as one of the most beneficial interactions in ecosystems, fostering symbiotic relationships that support multiple species in the food web.
2. Commensalism: One Benefits, the Other Is Unaffected
- In commensalism, one species gains a benefit from the relationship, while the other remains unaffected, neither harmed nor helped. This interaction is common in ecosystems, particularly in cases where one species provides resources or habitat to another.
- Example of Commensalism:
- Dung Beetles and Cows: Dung beetles feed on the feces of herbivores like cows. While the beetles benefit from the food source, the cows are unaffected by the beetles’ presence.
- Birds and Trees: Certain bird species may nest in the branches of trees. The birds gain shelter and protection, while the tree is neither harmed nor benefited by the presence of the birds.
- While not always as directly impactful as mutualism, commensalism still plays a role in the complex structure of food webs, offering opportunities for various species to coexist without competition or harm.
3. Competition: Both Species Are Harmed
- Competition occurs when two or more species require the same limited resource (e.g., food, space, or mates), leading to a reduction in fitness for all competing organisms. This interaction can lead to the exclusion of one species from a particular habitat or the adjustment of behavior to reduce competition.
Example of Competition:
- Two Bird Species Competing for Nesting Sites: If two species of birds compete for the same nesting site in a tree, the presence of one species can reduce the availability of space for the other, potentially resulting in declines in population for both.
- Herbivores Competing for Grass: Different herbivore species may compete for the same food resource in a grassland ecosystem, leading to reduced access to food and potentially stunted growth for both species.
- Competition can be harmful to species by limiting resources, and it often drives the evolutionary adaptations that help species partition resources and reduce direct competition.
4. Predation and Parasitism: One Species Benefits, the Other Is Harmed
- In predation and parasitism, one species benefits at the expense of another. Both interactions are integral to the energy flow within ecosystems, with predators controlling prey populations and parasites influencing host behaviors or physiology.
Examples of Predation and Parasitism:
- Predation: A lion kills and eats a zebra, gaining nutrients from the zebra’s body while causing harm to the zebra. Predators help maintain the balance of prey populations and contribute to the regulation of species numbers within ecosystems.
- Parasitism: Ticks attach to a host animal (e.g., a deer), feeding on its blood and potentially transmitting diseases. The tick benefits by gaining nourishment, while the host animal suffers harm due to blood loss or illness.
- These interactions play a vital role in population control and the regulation of species within an ecosystem.
5. Amensalism: One Species Is Harmed, the Other Is Unaffected
- In an amensalistic interaction, one species is harmed while the other remains unaffected. This type of interaction often involves physical or chemical mechanisms that inhibit the growth or survival of one species, but without benefiting the other.
Example of Amensalism:
- Tree Shading a Plant: A large tree may cast a dense shadow over a smaller plant, preventing it from receiving adequate sunlight. While the tree remains unaffected, the smaller plant is harmed by the lack of light.
- Allelopathy in Plants: Some plants release toxic chemicals into the soil to prevent the germination of nearby plants. For example, black walnut trees produce juglone, which inhibits the growth of other plants nearby.
- Amensalism is often a byproduct of other ecological interactions, like competition for space, light, or nutrients.
6. Neutralism: Neither Species Is Benefited or Harmed
- Neutralism is an interaction where two species live together in the same environment but do not directly affect one another. Neither species benefits or suffers from the relationship, and they exist independently, coexisting without influencing each other’s survival.
Example of Neutralism:
- Two Species of Birds Nesting in the Same Tree: Two bird species might occupy the same tree for shelter, but they do not interact directly or impact one another’s survival.
- Species in Different Ecosystems: For example, a terrestrial species and an aquatic species living in different niches might have no effect on each other, even though they share the same broader ecosystem.
- Although neutralism may seem rare, it occurs when species exist in different ecological niches, ensuring minimal or no impact on one another.
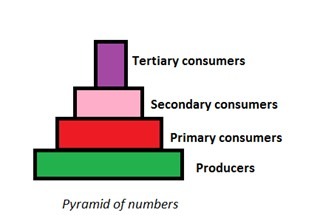
Ecological Pyramids:
Ecological pyramids are graphical representations that illustrate the structure and organization of energy flow through an ecosystem. They depict the relationships between different trophic levels, from primary producers at the base to top carnivores at the apex. The width of each bar in the pyramid indicates the total number, biomass, or energy of organisms present at that particular trophic level, showing the gradual decrease of energy, biomass, or numbers as we move from producers to higher consumers.
There are three main types of ecological pyramids, each highlighting different aspects of the ecosystem’s food web and energy dynamics:
Pyramids of Numbers
1. Pyramid of Numbers: Depicting Organism Count at Each Trophic Level
The Pyramid of Numbers visually represents the number of individual organisms present at each trophic level in an ecosystem. This pyramid can either be upright or inverted, depending on the nature of the ecosystem and the relative sizes of organisms at each level.
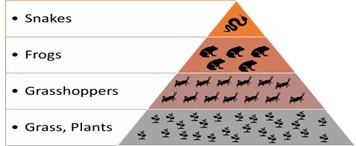
Upright Pyramid of Numbers:
In an upright pyramid, the number of individuals decreases as we ascend the trophic levels, which is typical in most ecosystems, such as a grassland ecosystem. This decrease reflects the energy transfer efficiency between levels, with more individuals at the base (producers) than at the higher trophic levels (top carnivores).
- Producers (Grass): The base of the pyramid is formed by producers such as grass, which are abundant in the ecosystem. They serve as the primary source of energy for all other organisms.
- Primary Consumers (Grasshoppers): The next level consists of primary consumers like grasshoppers. There are fewer grasshoppers than grass, reflecting the energy transfer from producers to herbivores.
- Primary Carnivores (Rats): Higher up, primary carnivores, such as rats, consume primary consumers. There are fewer rats than grasshoppers due to energy loss in the transfer.
- Secondary Carnivores (Snakes): Snakes, which prey on rats, form the next level. These carnivores are even fewer in number, reflecting the efficiency of energy transfer and the reduction of biomass at each level.
- Top Carnivores (Hawks): At the apex of the pyramid are the top carnivores, such as hawks. These animals represent the fewest individuals, as they are at the top of the food chain.
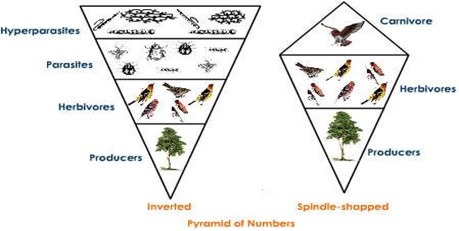
Inverted Pyramid of Numbers:
In contrast, an inverted pyramid of numbers occurs in ecosystems where large producers support numerous herbivores and higher-level consumers. For example, in a forest ecosystem, a few large trees at the base support many herbivores, like birds and insects, which in turn support parasites and predators. The base is narrow with large, long-lived producers, while the levels above can be broad due to the increasing number of smaller consumers.
Challenges of the Pyramid of Numbers
The Pyramid of Numbers can oversimplify the complexity of an ecosystem due to several limitations:
- Size Differences: It does not account for the size differences between species. A large tree at the base of the pyramid, for example, might support hundreds or thousands of smaller organisms, such as insects and birds, but it is only counted as one individual.
- Difficulties in Counting Individuals: Accurately counting individuals at each trophic level can be challenging, particularly in large ecosystems or when organisms are migratory or seasonal.
- Non-representative of Biomass: The pyramid focuses solely on the number of individuals, which does not always reflect the true biomass or energy flow in an ecosystem. Larger, longer-lived organisms may not appear significant if only their number is considered, even though they may contribute substantially to energy storage and flow.
2. Pyramid of Biomass: Energy and Mass Representation
The Pyramid of Biomass represents the total mass of organisms at each trophic level, providing a clearer picture of how much organic matter is present at each level. Typically, the biomass decreases as we move up the trophic levels, reflecting the loss of energy through respiration, growth, and energy transfer inefficiency.
This pyramid is useful for understanding the biomass distribution in an ecosystem, but it may not always be strictly pyramidal in shape. In certain ecosystems, like aquatic systems, the biomass of primary consumers (e.g., zooplankton) may exceed that of primary producers (e.g., phytoplankton), resulting in an inverted pyramid of biomass.
3. Pyramid of Energy or Productivity: Energy Flow Through the System
The Pyramid of Energy or Productivity is the most accurate representation of an ecosystem’s energy dynamics. This pyramid measures the flow of energy at each trophic level over time, showing how much energy is transferred from one level to the next.
Energy decreases unidirectionally as it flows from the base (producers) to the top carnivores, with a significant loss of energy at each step due to factors like heat loss, respiration, and waste production. Only a small fraction of energy is passed to the next trophic level (usually about 10%), and the rest is lost as heat or used in biological processes. The pyramid of energy is always upright, as energy decreases consistently from the base to the apex.
Pyramid of Biomass:
The Pyramid of Biomass offers a valuable insight into the total dry weight (usually measured in grams per square meter or g/m²) of organisms at each trophic level in an ecosystem. By addressing some of the limitations of the Pyramid of Numbers, it accounts for differences in size and biomass between organisms at various levels, offering a more accurate reflection of the biological energy storage within an ecosystem.
This pyramid provides a structural representation of biomass distribution and is particularly helpful in analyzing energy flow through ecosystems, as it shows the total amount of living material at each trophic level.
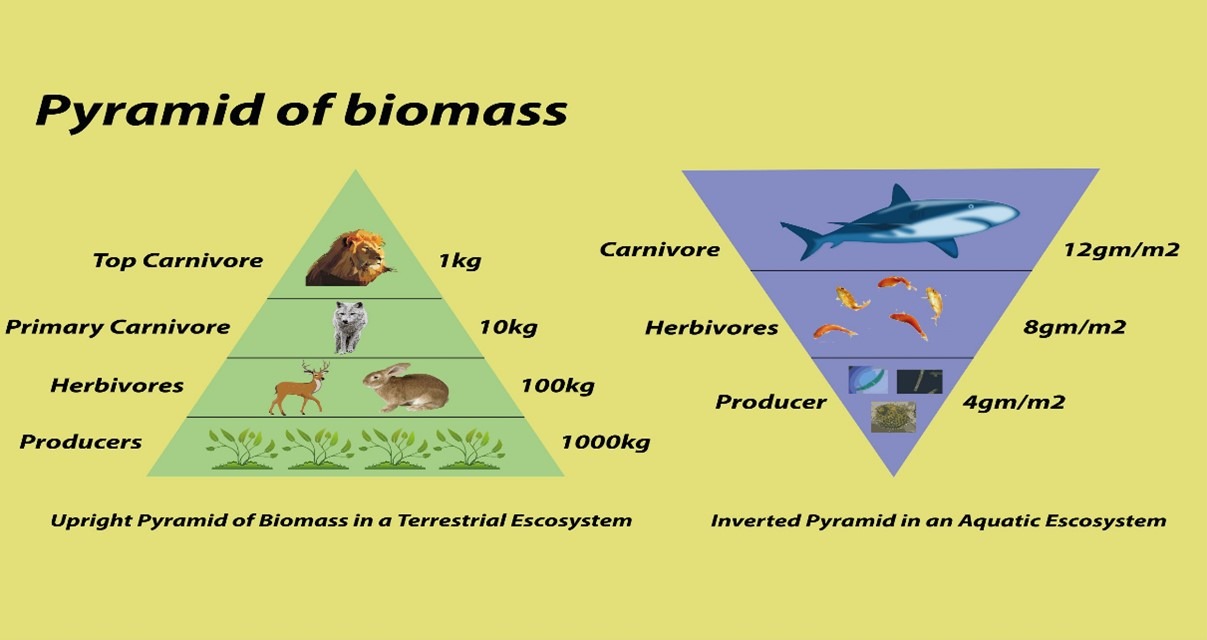
Upright Pyramid of Biomass: Common in Terrestrial Ecosystems
In terrestrial ecosystems, the Pyramid of Biomass usually takes an upright shape, meaning that there is a clear decrease in biomass as you move up from producers to top consumers. The base of the pyramid represents producers (like plants, algae, or autotrophs), which form the foundation of energy flow and have the maximum biomass. These organisms are responsible for capturing and converting solar energy through photosynthesis, storing it in the form of organic matter.
As you ascend the pyramid, biomass decreases due to energy losses that occur through respiration, growth, and consumption. Each subsequent trophic level supports fewer organisms and a smaller total biomass because only a portion of the energy at each level is passed to the next.
For example, in a grassland ecosystem:
- Producers (Grass): Grass and other plants are abundant at the base, having the highest biomass.
- Primary Consumers (Herbivores): Animals like grasshoppers or cattle consume the plants, but their biomass is much smaller than that of the plants.
- Secondary Consumers (Carnivores): Carnivores like rats or snakes feed on herbivores, but their biomass is even smaller.
- Top Carnivores (Hawks): At the apex, top predators such as hawks have the least biomass due to their position at the top of the food chain.
This declining trend is typical of most terrestrial ecosystems, where the biomass pyramid follows a fairly predictable shape, with a substantial biomass base that supports a progressively smaller number of organisms at higher trophic levels.
Inverted Pyramid of Biomass: Found in Aquatic Ecosystems
Contrasting the upright pyramid, an inverted pyramid of biomass is commonly observed in aquatic ecosystems, where the biomass of consumers exceeds that of the producers. This unique phenomenon occurs primarily because the producers in aquatic ecosystems are typically small, rapidly reproducing organisms like phytoplankton, which have a very low biomass per individual but can produce large amounts of energy in a short period.
In aquatic environments, such as ponds or lakes, phytoplankton form the base of the food chain and are consumed by primary consumers like zooplankton. Despite their high turnover rate and rapid reproduction, their biomass is relatively low when compared to the larger, more long-lived consumers like fish or invertebrates that feed on them. As a result, the pyramid appears inverted:
- Producers (Phytoplankton): Although they form the base of the food chain, they have a relatively low biomass compared to consumers, as individual phytoplankton are small and short-lived.
- Primary Consumers (Zooplankton): Zooplankton consume phytoplankton and have a larger individual biomass, resulting in a larger total biomass at this level.
- Secondary Consumers (Fish): Larger fish, which feed on zooplankton, have a much higher biomass compared to the producers.
- Top Consumers (Predatory Fish, Birds): At the top of the pyramid are large predators, such as predatory fish and birds, which typically have the largest individual biomass, but their population is relatively small.
This inverted shape occurs due to the rapid turnover of biomass in aquatic food webs, where producers (phytoplankton) are consumed quickly and replaced, allowing higher trophic levels to accumulate more biomass despite the small amount of biomass at the base.
Why Understanding the Pyramid of Biomass Is Important
The Pyramid of Biomass is an essential tool for ecologists because it helps quantify the energy storage in an ecosystem at each trophic level, offering a more accurate depiction of the flow of energy through an ecosystem compared to the Pyramid of Numbers. It also illustrates how different ecosystems operate in terms of energy efficiency and biological productivity:
- Terrestrial ecosystems typically show an upright pyramid, emphasizing the energy loss as organisms move up the food chain.
- Aquatic ecosystems, on the other hand, can present an inverted pyramid due to the rapid turnover of small primary producers and the larger biomass of consumers.
This insight is crucial for understanding energy efficiency, species interactions, and ecosystem sustainability, which can inform ecological conservation efforts, habitat management, and resource utilization strategies.
4o mini
Pyramid of Energy:
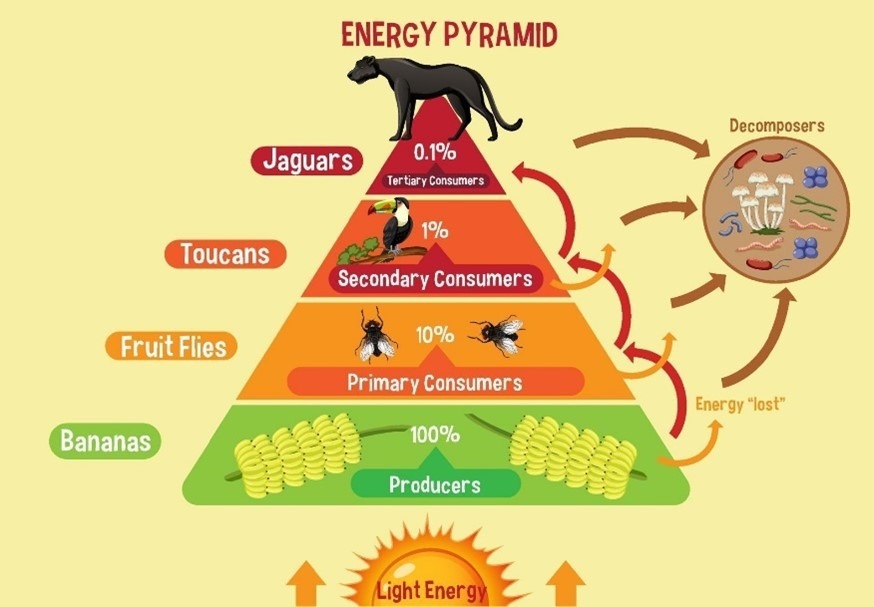
The energy pyramid is a graphical representation that shows the flow of energy through an ecosystem, highlighting the energy transfer between various trophic levels. It follows the principles of the laws of thermodynamics, particularly the second law, which states that energy is lost as heat during transfer. This concept explains why energy decreases as it moves upward through each trophic level, creating an upright pyramid shape with a broad base at the bottom, where primary producers reside.
At the base of the energy pyramid are the primary producers, such as plants and algae, which capture solar energy through photosynthesis. Although these organisms absorb a large amount of sunlight, only a portion of this energy is stored as chemical energy in the form of biomass. The rest is used for cellular respiration or lost as heat.
For example, if an ecosystem receives 1000 calories of solar energy, plants might only store about 100 calories as energy-rich material after using some of the energy for their metabolic activities. Herbivores, such as a deer, that feed on these plants can only consume a fraction of this stored energy. Typically, a deer would store only 10 calories from the plants it consumes, while the remaining energy is lost as heat, or used for the deer’s own metabolic processes.
When a carnivore, like a lion, consumes the deer, it only retains a small portion of the energy, often just a few calories. The energy decreases progressively as you move up the trophic levels because each organism expends energy for growth, movement, and reproduction, while also losing energy to heat.
This energy loss at each level limits the number of trophic levels in an ecosystem. As a result, there are generally fewer apex predators at the top of the pyramid compared to primary producers at the base, reflecting the overall decrease in available energy.
Understanding the energy pyramid is crucial for comprehending the dynamics of ecosystems and the importance of primary producers in sustaining life. It also emphasizes why energy efficiency is vital for maintaining biodiversity and ecosystem health.
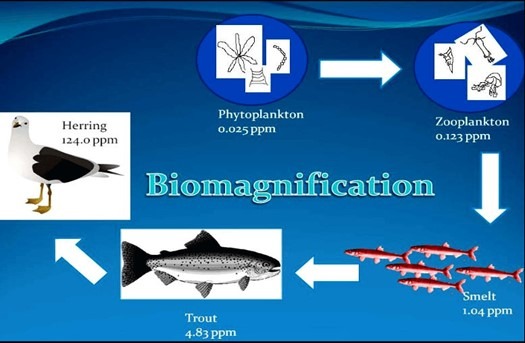
This concept also explains biological magnification, where toxic substances concentrate increasingly at higher trophic levels in the food chain.
Limitations of Ecological Pyramids:
Ecological pyramids offer a simplified model of energy flow through ecosystems by depicting the relationships between different trophic levels. However, they typically assume a straightforward food chain and do not account for species that occupy multiple trophic levels or complex food webs. This simplification overlooks the intricate dynamics of ecosystems, where many species, such as omnivores, play roles in various trophic levels. Additionally, ecological pyramids often exclude the important contributions of saprophytes, such as fungi and microorganisms, which play a vital role in decomposing organic matter and recycling nutrients, essential for sustaining ecosystems.
Pollutants and Trophic Levels
One of the significant concerns in ecosystems is the movement of pollutants through trophic levels. Nondegradable pollutants, such as chlorinated hydrocarbons, are substances that do not break down or degrade over time. These pollutants, because they cannot be metabolized or eliminated efficiently by living organisms, accumulate in the environment. Even at low concentrations, they can become hazardous, especially as they move through the food chain, affecting different species across various trophic levels.
The movement of pollutants through an ecosystem involves two critical processes: bioaccumulation and biomagnification. These phenomena explain how pollutants persist and become more concentrated as they travel up the food chain, posing increasing risks to higher trophic levels.
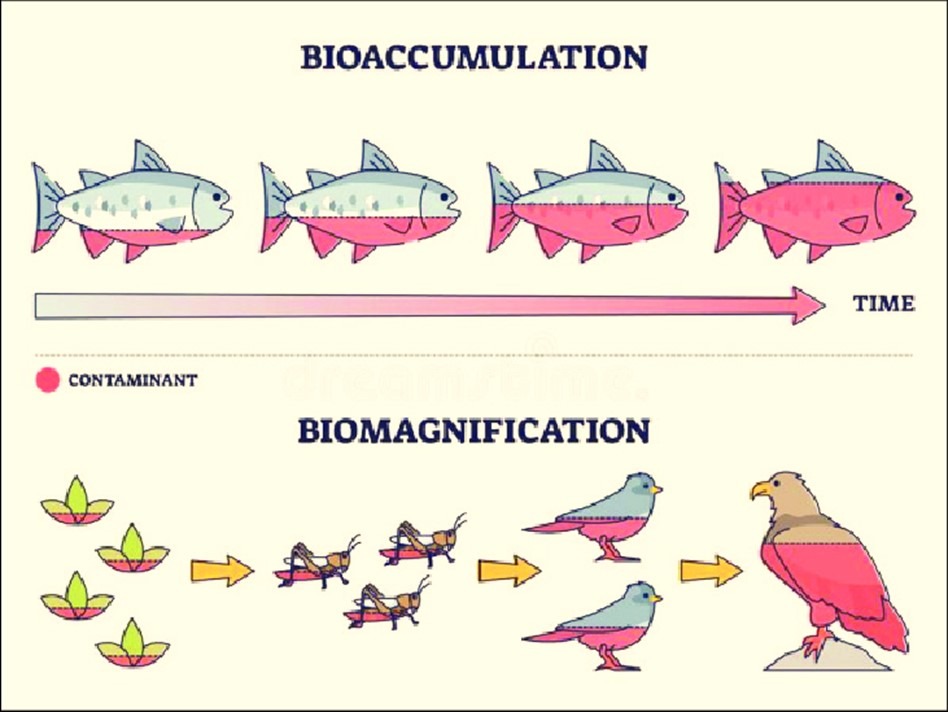
i) Bioaccumulation:
Bioaccumulation refers to the gradual buildup of pollutants or toxic substances within an organism over time. This occurs when the rate of accumulation of a substance surpasses the rate at which it is excreted or broken down by the organism. Over time, the concentration of these substances in the organism can reach harmful levels. For example, persistent organic pollutants (POPs) like DDT, which are highly resistant to environmental degradation, tend to accumulate in the tissues of organisms that come into contact with them, even in very low concentrations in the environment. This buildup can lead to toxic effects and health risks, as the pollutant reaches higher concentrations in the organism than in the surrounding environment.
ii) Biomagnification:
Biomagnification, also known as biological magnification, is the process through which the concentration of pollutants increases as they move up the food chain. Unlike bioaccumulation, which occurs within an individual organism, biomagnification affects entire populations or species at different trophic levels. For biomagnification to take place, the pollutant must possess certain characteristics: it must be long-lived (persistent), fat-soluble, mobile, and biologically active. These properties ensure that the pollutant remains in the ecosystem, travels through different levels, and accumulates in the fatty tissues of organisms at each subsequent trophic level.
For example, pollutants such as DDT or mercury are fat-soluble, meaning they dissolve in fats and oils and accumulate in the fatty tissues of organisms. Since these chemicals are not easily excreted or metabolized, they persist for long periods, becoming more concentrated as each organism at a higher trophic level consumes organisms at lower levels. As a result, apex predators, such as eagles or large fish, often carry the highest concentrations of pollutants, even though they may have never been directly exposed to the source of contamination.
Short-lived pollutants, on the other hand, are less likely to cause biomagnification because they break down before they can accumulate to harmful levels. Conversely, mobile pollutants spread across ecosystems, further increasing the potential for accumulation and magnification in various species.
Fat-soluble pollutants are particularly dangerous because they remain in the organism for extended periods, accumulating in the body’s fat tissues rather than being readily excreted. This accumulation is often measured in the fatty tissues of aquatic organisms, like fish, or in mammalian milk, both of which are highly vulnerable to the build-up of toxic substances.
Consequences and Environmental Impact
The presence of pollutants in an ecosystem can have far-reaching consequences, particularly when it comes to higher trophic levels. As pollutants move up the food chain through bioaccumulation and biomagnification, they can disrupt reproduction, growth, and overall health in species. For instance, birds of prey exposed to high levels of DDT in their diet experienced thinning eggshells, leading to a dramatic decline in their populations. Similarly, the accumulation of mercury in fish can result in toxic levels that affect aquatic life and those who consume contaminated fish, including humans.
In addition to individual species, biomagnification can cause imbalances in entire ecosystems, reducing biodiversity and altering the structure of food webs. It can also impact human health, particularly in populations that rely on fish or other animal products for food.