Terrestrial Ecosystems or Biomes:
The biosphere—the living layer of our planet—is divided into vast, distinct regions known as biomes. Each biome is shaped by its unique climate (particularly temperature and precipitation), vegetation, wildlife, and soil composition. These factors create specialized ecosystems where only certain plants and animals can thrive.
Understanding biomes helps us appreciate Earth’s biodiversity, recognize environmental threats, and implement effective conservation strategies. Below, we explore the major terrestrial biomes, their characteristics, and their global significance.
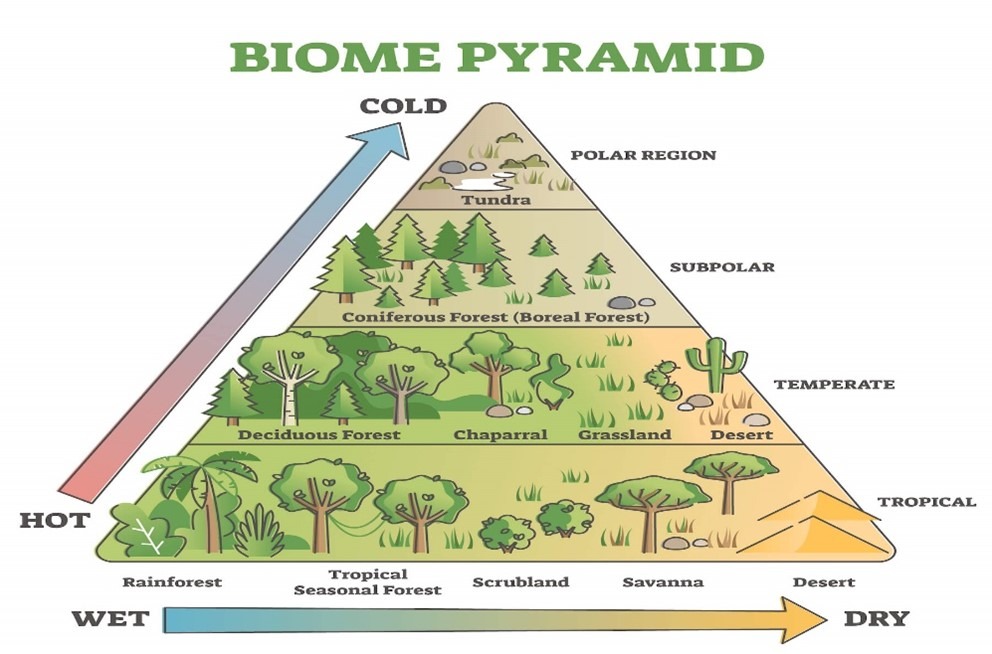
Major Biomes:
Tundra
- Arctic and Alpine Tundra Biome
Forest
- Taiga or Boreal Biome (Evergreen Coniferous Forests)
- Temperate Deciduous Biome (North-Western Europe – British Climate)
- Temperate Rainforest Biome
- Sub-Tropical Deciduous Biome (Eastern China, Southeastern USA)
- Temperate Deciduous Biome (Mediterranean Climate)
- Tropical Deciduous Biome (Monsoon Climate)
- Tropical Rainforest Biome
Grassland
- Steppe or Temperate Grassland Biome
- Savanna or Tropical Wet and Dry Biome (Tropical Shrublands and Grasslands)
Desert
- Tropical and Mid-Latitude Desert Biome
1. Tundra Biome: The Frozen Wilderness
Subtypes:
- Arctic Tundra (Northern Canada, Alaska, Siberia)
- Alpine Tundra (High mountain ranges like the Rockies, Himalayas, Andes)
Key Features:
- Extremely cold with long winters and short summers.
- Low precipitation (mostly snow).
- Permafrost—a permanently frozen subsoil layer.
- Sparse vegetation: Mosses, lichens, dwarf shrubs, and hardy grasses.
- Wildlife: Polar bears, Arctic foxes, caribou, snowy owls, and migratory birds.
Ecological Importance:
- Acts as a carbon sink, storing large amounts of CO₂ in frozen soil.
- Sensitive to climate change, as melting permafrost releases greenhouse gases.
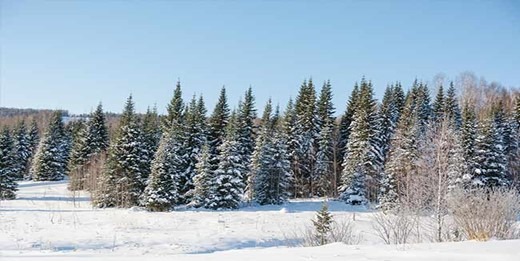
2. Forest Biomes: The Lungs of the Earth
A. Taiga (Boreal Forest) Biome
- Location: Canada, Scandinavia, Russia.
- Climate: Long, harsh winters; short, mild summers.
- Vegetation: Dominated by coniferous trees (spruce, pine, fir).
- Wildlife: Moose, wolves, bears, lynx, migratory birds.
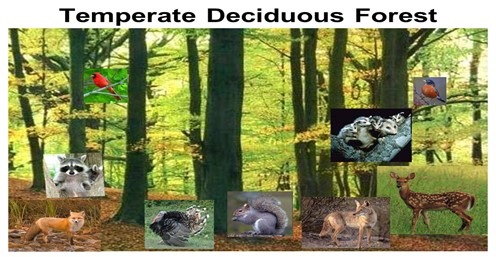
B. Temperate Deciduous Forest Biome
- Location: Eastern USA, Western Europe, East Asia.
- Climate: Four distinct seasons; moderate rainfall.
- Vegetation: Deciduous trees (oak, maple, beech).
- Wildlife: Deer, foxes, squirrels, owls, amphibians.
C. Temperate Rainforest Biome
- Location: Pacific Northwest (USA, Canada), New Zealand, Chile.
- Climate: High rainfall, mild temperatures year-round.
- Vegetation: Giant redwoods, ferns, mosses.
- Wildlife: Black bears, cougars, eagles, salmon.
D. Tropical Rainforest Biome
- Location: Amazon, Congo Basin, Southeast Asia.
- Climate: Hot and humid year-round; heavy rainfall.
- Vegetation: Dense canopy with diverse species (mahogany, rubber trees, orchids).
- Wildlife: Jaguars, toucans, monkeys, anacondas, countless insects.
Ecological Importance:
- Forests produce oxygen, regulate climate, and host 50% of Earth’s biodiversity.
- Deforestation threatens carbon storage and wildlife habitats.
Temperate Deciduous Biome (North-Western Europe – British Climate):
The temperate deciduous forest biome is one of Earth’s most dynamic and visually stunning ecosystems, characterized by four distinct seasons, rich biodiversity, and fertile soils. Found in regions with moderate climates—such as Eastern North America, Western Europe, and parts of East Asia—this biome plays a crucial role in carbon sequestration, wildlife habitats, and ecological balance.
Below, we explore its key features, vegetation, soil composition, seasonal adaptations, and ecological significance in detail.
1. Soil Composition: The Fertile Foundation
The soils in temperate deciduous forests are primarily podzolic, meaning they are:
- Relatively deep, allowing for strong root systems.
- Well-drained, preventing waterlogging.
- Rich in organic matter due to decomposing leaf litter.
- Slightly acidic, which influences nutrient availability.
Why Does Soil Matter?
- Supports diverse plant life, from towering trees to understory shrubs.
- Acts as a carbon sink, storing decomposed organic material.
- Provides nutrients for agriculture (many fertile farmlands were originally deciduous forests).
2. Vegetation: The Majestic Deciduous Trees
The defining feature of this biome is its deciduous trees, which shed leaves in autumn (fall) to survive winter.
Why Do Trees Lose Their Leaves?
- Frost Protection: Leaves would freeze and damage branches.
- Water Conservation: Reduces moisture loss in cold, dry winters.
- Energy Efficiency: Dormancy saves resources until spring.
Common Tree Species
Tree Species | Characteristics |
Oak | Strong, durable wood; supports diverse wildlife. |
Elm | Once widespread, now threatened by Dutch elm disease. |
Ash | Valued for timber; endangered by emerald ash borer. |
Birch | Fast-growing, with distinctive white bark. |
Beech | Smooth gray bark; produces edible nuts. |
Poplar | Rapid growth; used in paper production. |
Understory & Forest Floor
- Shrubs: Rhododendron, blueberry, hazel.
- Herbs & Ferns: Trillium, wild ginger, bracken.
- Fungi & Mosses: Essential for decomposition.
3. Seasonal Changes: A Cycle of Renewal
Temperate deciduous forests undergo dramatic transformations throughout the year:
Spring (March–June)
- New leaves emerge, turning the forest bright green.
- Wildflowers bloom (e.g., bluebells, violets).
- Migratory birds return, filling the forest with song.
Summer (June–September)
- Full canopy provides shade, cooling the forest floor.
- High biodiversity: Insects, mammals, and birds thrive.
Autumn / Fall (September–December)
- Leaves change color (red, orange, yellow) due to chlorophyll breakdown.
- Leaf litter accumulates, enriching the soil.
- Animals prepare for winter (squirrels gather nuts, birds migrate).
Winter (December–March)
- Trees stand bare, conserving energy.
- Snow cover insulates roots and small animals.
- Fewer active species, but some remain (deer, foxes, owls).
4. Wildlife: A Thriving Ecosystem
The temperate deciduous forest supports a wide range of animals, including:
Mammals
- White-tailed deer (browse on shrubs).
- Red foxes (adaptable predators).
- Black bears (hibernate in winter).
- Squirrels & chipmunks (seed dispersers).
Birds
- Woodpeckers (control insect populations).
- Owls (nocturnal hunters).
- Warblers (migratory insect-eaters).
Reptiles & Amphibians
- Salamanders (indicator species for forest health).
- Turtles & snakes (sunbathe in clearings).
Insects
- Butterflies & bees (pollinators).
- Decomposers (earthworms, beetles, fungi).
5. Ecological & Human Importance
Environmental Benefits
✔ Carbon Storage: Trees absorb CO₂, mitigating climate change.
✔ Water Regulation: Forests prevent soil erosion and filter rainwater.
✔ Biodiversity Hotspot: Home to thousands of interdependent species.
Human Uses
✔ Timber & Paper: Sustainable forestry is crucial.
✔ Recreation: Hiking, birdwatching, and ecotourism.
✔ Agriculture: Fertile soils support crops (historically, many farms replaced forests).
Threats & Conservation
⚠ Deforestation: Logging and urban expansion reduce habitats.
⚠ Invasive Species: Pests like the emerald ash borer kill trees.
⚠ Climate Change: Alters seasonal cycles and species distribution.
Conservation Efforts:
- Reforestation programs.
- Protected national parks (e.g., Great Smoky Mountains, USA).
- Sustainable logging practices.
Temperate Rainforest Biome:
The temperate rainforest biome represents one of Earth’s most biodiverse yet geographically restricted ecosystems. Occupying only 0.2% of the planet’s land surface, these forests are precious reservoirs of ancient trees, unique wildlife, and complex ecological relationships. Unlike tropical rainforests, temperate versions thrive in cooler coastal climates with consistent moisture from ocean influences.
Global Distribution: Where in the World?
While small in total area, temperate rainforests appear in scattered pockets across the globe where specific climatic conditions converge:
Primary Regions
- Pacific Northwest (North America): Stretching from northern California to southern Alaska, this is the largest continuous temperate rainforest, home to iconic giants like Douglas firs and redwoods.
- Valdivian Forests (Chile & Argentina): South America’s counterpart features evergreen beech (Nothofagus) and the rare alerce tree, a relative of sequoias.
- New Zealand & Southeastern Australia: Dominated by southern beech and towering tree ferns, these forests evolved in isolation with unique species like the flightless kiwi.
- Scattered Outposts: Smaller patches exist in Norway, Japan, the UK’s Celtic rainforests, and the Caucasus Mountains.
Climate: The Recipe for a Rainforest
What makes a rainforest “temperate”? Three key factors:
1. Abundant Precipitation (60-200 inches/year)
- Coastal fog and year-round rainfall sustain lush growth.
- Moisture comes from prevailing ocean winds hitting mountain ranges.
2. Mild Temperatures (40-70°F annual average)
- Cool summers and frost-free winters (in lowland areas).
- Rare extremes due to maritime influence.
3. High Humidity (Often 80-100%)
- Creates ideal conditions for epiphytes (air plants) and decomposers.
Flora: Giants and Epiphytes
Canopy Titans
These forests are defined by some of the world’s most massive trees:
- Douglas fir (Pseudotsuga menziesii): Up to 330 ft tall, lives 1,000+ years.
- Western red cedar (Thuja plicata): Rot-resistant wood prized by Indigenous peoples.
- Sitka spruce (Picea sitchensis): Thrives in salty coastal winds.
- Southern beech (Nothofagus spp.): Dominant in Southern Hemisphere forests.
The Understory Tapestry
Beneath the towering conifers thrives a layered world:
- Epiphytes: Mosses, lichens, and ferns carpet branches (“canopy soil”).
- Shrubs: Salmonberry, huckleberry, and devil’s club.
- Ferns & Herbs: Sword ferns reach 6 ft tall; oxalis carpets the floor.
Decay = Life
- Fallen “nurse logs” support seedling growth.
- Fungi like Phellinus weirii create “fairy rings” of tree mortality.
Fauna: From Canopy to Forest Floor
Iconic Mammals
- Spotted owls: Indicator species for old-growth health.
- Marbled murrelets: Seabirds that nest in mossy branches.
- Roosevelt elk: North America’s largest elk subspecies.
Specialized Invertebrates
- Banana slugs: Bright yellow decomposers.
- Velvet worms: Ancient predators that shoot sticky slime.
Southern Hemisphere Uniques
- Kiwi birds (New Zealand)
- Monito del monte (Chilean marsupial)
Threats & Conservation Challenges
Despite their resilience, these forests face mounting pressures:
Threat | Impact | Conservation Actions |
Logging | Loss of 1,000-year-old trees | Old-growth protections (e.g., Clayoquot Sound) |
Climate Change | Drier summers, pest outbreaks | Corridor preservation for species migration |
Invasive Species | Deer overbrowse seedlings | Restoration planting of native species |
Success Story: The Great Bear Rainforest (BC, Canada) now has 85% protection through Indigenous-led conservation.
Why These Forests Matter
1. Carbon Storage: Old-growth trees sequester 2-3x more carbon than young forests.
2. Biodiversity: Hotspots for endemic species.
3. Cultural Value: Home to Indigenous knowledge systems (e.g., cedar weaving traditions).
Experience a Temperate Rainforest
Top Locations to Visit:
1. Olympic National Park (Washington)
2. Tongass National Forest (Alaska)
3. Fiordland National Park (New Zealand)
4. Chiloé Island (Chile)
What to Observe:
- Morning fog weaving through giant trees
- Vibrant green epiphyte gardens
- Banana slugs crossing fern-lined trails
Sub-Tropical Deciduous Biome (Eastern China, Southeastern USA):
The sub-tropical deciduous biome represents one of nature’s most fascinating ecological crossroads, where tropical exuberance meets temperate resilience. This distinctive biome thrives in regions that experience:
- Mild winters with occasional frosts
- Pronounced wet and dry seasons
- Annual temperature ranges between 10-30°C (50-86°F)
- Annual precipitation of 1,000-2,000 mm (39-79 inches)
Found in geographically limited but ecologically significant areas, this biome serves as a vital transition between tropical rainforests and temperate deciduous forests, creating unique habitats that support exceptional biodiversity.
Global Distribution and Regional Variations
This biome occupies specific latitudinal bands across several continents:
Primary Regions
1. Southeastern United States
- Appalachian foothills to Gulf Coast
- Characterized by mixed pine-hardwood forests
2. Eastern China
- Yangtze River basin and southern provinces
- Features remarkable plant endemism
3. Mediterranean Transition Zones
- Parts of Spain, Italy, and the Balkan Peninsula
- Unique adaptations to summer drought
4. Southern Hemisphere Outposts
- Southern Brazil’s Atlantic Forest
- Northern New South Wales, Australia
Climate: The Seasonal Rhythm of Life
Three key climatic factors shape this biome’s character:
1. Temperature Patterns
- Summer averages: 25-30°C (77-86°F)
- Winter averages: 5-15°C (41-59°F)
- Fewer than 30 frost days annually in most areas
2. Precipitation Regimes
- Distinct wet season (spring/summer monsoon in Asia)
- Milder dry season compared to tropical dry forests
- Frequent fog and humidity mitigate drought stress
3. Growing Season Dynamics
- 9-11 month growing period
- Brief dormancy only in coldest/driest months
- Some species exhibit drought-deciduous behavior
Vegetation: A Symphony of Adaptation Strategies
Lowland Mixed Forests
The biome’s most biodiverse stratum features:
Deciduous Hardwoods:
- Liquidambar formosana (Chinese sweet gum) – brilliant fall colors
- Quercus variabilis (Chinese cork oak) – fire-resistant bark
- Carya illinoinensis (pecan) – important food source
Evergreen Broadleaves:
- Magnolia grandiflora (southern magnolia) – waxy leaf coating
- Osmanthus fragrans (tea olive) – year-round flowering
- Quercus virginiana (live oak) – deep taproots
Highland Conifer Communities
Elevational changes bring conifer dominance:
Pine Species:
- Pinus elliottii (slash pine) – rapid growth in poor soils
- Pinus massoniana (Chinese red pine) – fire-adapted cones
Cypress Varieties:
- Taxodium distichum (bald cypress) – flood tolerance
- Cupressus funebris (Chinese weeping cypress) – drought resistance
The Remarkable Understory
A diverse ground layer thrives year-round:
Shrubs:
- Kalmia latifolia (mountain laurel) – toxic foliage deters herbivores
- Rhododendron maximum (great laurel) – water storage in leaves
Herbaceous Plants:
- Panax ginseng – slow-growing medicinal root
- Arisaema triphyllum (jack-in-the-pulpit) – thermogenic flowers
Specialized Epiphytes:
- Spanish moss (Tillandsia usneoides) – atmospheric water capture
- Resurrection fern (Pleopeltis polypodioides) – desiccation tolerance
Wildlife: Masters of Seasonal Exploitation
The biome supports fauna adapted to its transitional nature:
Mammalian Adaptations
- White-tailed deer – seasonal coat changes
- Fox squirrels – scatter-hoarding behavior
- Chinese pangolin – specialized ant/termite diet
Avian Strategies
- Pileated woodpeckers – cavity nesting in mature trees
- Japanese white-eyes – nectar-feeding specialists
- Scarlet tanagers – long-distance neotropical migrants
Herpetofauna Highlights
- Eastern box turtle – long-lived forest floor dweller
- Chinese giant salamander – fully aquatic predator
- Copperhead snakes – cryptic leaf-litter ambush predators
Ecological Services and Human Connections
Critical Ecosystem Functions
- Carbon sequestration through rapid summer growth
- Water filtration via deep, extensive root systems
- Biodiversity reservoirs with high endemism rates
Human Utilization Patterns
1. Traditional Uses:
- Medicinal plants (ginseng, magnolia bark)
- Durable timber (white oak, cypress)
- Edible nuts and fruits (pecans, persimmons)
2. Modern Challenges:
- Urban sprawl into forested areas
- Invasive species competition
- Climate change impacts on phenology
Conservation Priorities and Strategies
Major Threats
- Habitat fragmentation from agricultural expansion
- Altered fire regimes affecting regeneration
- Pest outbreaks (emerald ash borer, pine beetles)
Innovative Solutions
- Urban forest corridors in expanding cities
- Assisted migration for climate-threatened species
- Community-based conservation initiatives
Success Story: The restoration of American chestnut through blight-resistant hybrids demonstrates recovery potential for dominant species.
Visitor Experiences and Ecotourism
Prime Observation Sites
- Great Smoky Mountains National Park (USA)
- World record for tree diversity (130+ species)
- Tianmu Mountain Biosphere Reserve (China)
- Ancient ginkgo and dawn redwood stands
- Garajonay National Park (Canary Islands)
- Relict subtropical laurel forests
Seasonal Highlights
- Spring: Wildflower displays (trilliums, bloodroot)
- Summer: Canopy full of breeding songbirds
- Autumn: Vibrant fall foliage (maples, sweetgums)
- Winter: Evergreen contrast against bare branches
Tropical Deciduous Biome (Monsoon Climate):
Tropical monsoon forests, also known as drought-deciduous or dry deciduous forests, represent one of Earth’s most dynamic ecosystems. These forests undergo dramatic seasonal transformations, shedding leaves during prolonged dry periods to conserve water, then bursting back to life with the monsoon rains. Found primarily in South and Southeast Asia, parts of Africa, and northern Australia, these forests support unique biodiversity adapted to cyclical drought and deluge.
Key Characteristics
- Pronounced wet-dry seasonal cycle
- Canopy height of 15-25 meters (shorter than rainforests)
- Rich in economically valuable timber species
- Fire-adapted ecosystems in many regions
- Critical habitat for endangered megafauna
Global Distribution and Regional Variations
Monsoon forests form a transitional zone between tropical rainforests and savannas, occurring in:
Major Regions
1. South Asia
- India’s Deccan Plateau
- Western Ghats foothills
- Indo-Gangetic Plain
2. Southeast Asia
- Myanmar’s teak forests
- Thailand’s dry dipterocarp woodlands
- Eastern Java’s monsoon forests
3. Other Locations
- East Africa’s coastal forests
- Northern Australia’s monsoon tropics
- Pacific coast of Central America
Climate Drivers
- Annual rainfall: 1,000-2,000 mm (39-79 in)
- Distinct 3-6 month dry season
- Temperature range: 20-35°C (68-95°F)
- Frequent monsoon winds
Iconic Tree Species: Pillars of the Forest
Timber Giants
Species | Scientific Name | Characteristics | Economic Importance |
Teak | Tectona grandis | Golden-brown termite-resistant wood | Premier shipbuilding/furniture material |
Sal | Shorea robusta | Hard, durable timber | Railroad ties, construction |
Shisham | Dalbergia sissoo | Rosewood relative | Luxury furniture, musical instruments |
Sandalwood | Santalum album | Fragrant heartwood | Perfumes, carvings, religious use |
Ecological Engineers
Neem (Azadirachta indica):
- Natural pesticide properties
- Used in traditional medicine
Bamboo (various Bambusoideae):
- Rapid growth (up to 91 cm/day)
- Critical panda habitat in Asia
Khair (Acacia catechu):
- Nitrogen-fixing properties
- Source of natural dye and medicine
Adaptive Strategies: Surviving the Dry Season
Plant Survival Mechanisms
1. Leaf Shedding (Drought-Deciduous)
- Reduces water loss
- 70-90% of trees lose leaves
2. Thick Bark
- Fire resistance
- Insulation against heat
3. Underground Storage
- Bulbous roots/corms
- Rapid regrowth after rains
Animal Adaptations
- Elephants: Follow seasonal water sources
- Tigers: Concentrate near remaining waterholes
- Langurs: Shift diet to dry-season foods
- Dormant Insects: Enter diapause (suspended development)
Biodiversity Hotspots
Flagship Wildlife
Mammals:
- Asian elephants
- Bengal tigers
- Sloth bears
- Gaur (Indian bison)
Birds:
- Indian peafowl
- Great hornbill
- Painted stork
Reptiles:
- King cobra
- Monitor lizards
- Star tortoise
Unique Ecological Relationships
- Myrmecophytes: Ant-housing plants like Acacia
- Pollination Syndromes: Bat-pollented baobabs
- Seed Dispersal: Elephants spread fruiting trees
Human Connections Through History
Traditional Uses
- Ayurvedic Medicine: Neem, sandalwood, arjuna
- Sustainable Forestry: 200-year-old teak management systems
- Cultural Significance: Sacred groves across India
Modern Economic Importance
- Timber Industry: $3 billion annual teak trade
- Silk Production: Mulberry leaves feed silkworms
- Ecotourism: Tiger reserves generate major revenue
Conservation Challenges
Major Threats
- Deforestation Rates: 1-2% annual loss in some regions
- Illegal Logging: Particularly for rosewoods
- Climate Change: Altered monsoon patterns
- Human-Wildlife Conflict: Crop raiding by elephants
Protection Efforts
- Project Tiger (India): 53 reserves established
- FSC-Certified Plantations: Sustainable teak farms
- Community Forest Management: Local stewardship programs
Experience Monsoon Forests
Best Visiting Times
- Post-Monsoon (Oct-Dec): Lush regrowth, waterfalls
- Dry Season (Mar-May): Better wildlife viewing
Top Ecotourism Destinations
1. Bandipur National Park, India
- Teak-dominated forests
- High tiger density
2. Cat Tien National Park, Vietnam
- Endangered Javan rhino habitat
- Dipterocarp forests
3. Wasgamuwa National Park, Sri Lanka
- Elephant migratory routes
- Ancient irrigation tanks
Tropical Rainforest Biome:
Rainforests represent the most biodiverse and ecologically vital ecosystems on Earth, spanning only 6% of the planet’s surface yet supporting over half of all terrestrial species. These complex ecosystems function as:
- Climate regulators through carbon sequestration
- Biological treasure troves with undiscovered medicines
- Hydrological powerhouses driving global water cycles
- Cultural strongholds for indigenous knowledge systems
Canopy Architecture: A Vertical Civilization
Structural Layers of Life
1. Emergent Layer (40-70m)
- Giant hardwoods: Dipteryx (tonka bean), Dinizia excelsa
- Harpy eagle nesting sites
- Specialized bromeliad “tanks” holding 20L water
2. Main Canopy (20-40m)
- Continuous leafy ceiling
- 70% of rainforest species inhabit this zone
- Strangler figs creating “tree apartments”
3. Understory (5-20m)
- Dappled light environment
- Palms, young trees, shade-tolerant shrubs
- Hunting ground for jaguars and leopards
4. Forest Floor (<5m)
- Rapid decomposition (leaf litter disappears in 6 weeks)
- Giant earthworms up to 3m long
- Mycorrhizal networks (“Wood Wide Web”)
Specialized Plant Adaptations
- Buttress roots: Extend 15m up trunks for stability
- Drip tips: 5-10° leaf angles for water runoff
- Cauliflory: Flowers/fruits grow directly on trunks
- Epiphyte gardens: Single tree may host 80 orchid species
Biodiversity: Nature’s Grand Library
Species Richness by Taxon
Group | Estimated Species | % of Global Total |
Insects | 10 million+ | 90% of arthropods |
Plants | 50,000+ | 2/3 of all species |
Birds | 1,300+ | 40% of global avifauna |
Mammals | 500+ | 20% of all species |
Medicinal Wealth
- 120 prescription drugs derived from rainforest plants
- 70% of cancer-fighting plants from tropical forests
- Quinine (malaria treatment) from cinchona bark
- Vinblastine (Hodgkin’s therapy) from rosy periwinkle
Climate Engine: Global Atmospheric Control
Biogeochemical Services
1. Carbon Dynamics
- Stores 250 billion tons of carbon in biomass
- Amazon alone absorbs 5% of global CO₂ emissions
- Current net loss: 1.5 billion tons carbon/year
2. Water Recycling
- 50-80% humidity maintained by transpiration
- “Flying rivers” transport 20 billion tons water/day
- Generates 30-50% of regional rainfall
3. Climate Regulation
- Surface cooling through evapotranspiration
- Cloud formation nuclei from volatile organics
- Buffers against extreme weather events
Anthropogenic Threats: The Great Unraveling
Deforestation Fronts
Region | Annual Loss | Primary Drivers |
Brazilian Amazon | 1.5M hectares | Cattle (80%), soy (15%) |
Congo Basin | 500,000 ha | Palm oil, subsistence farming |
Indonesia | 800,000 ha | Pulpwood, palm oil |
Mesoamerica | 200,000 ha | Drug trafficking land grabs |
Fire Dynamics
- 2019 Amazon fires: 900% increase over 2018
- Peat fires: Burn underground for months
- Aerosol emissions: 25% of global black carbon
Tipping Points
- Amazon dieback: 20-25% deforestation threshold
- Hydrological collapse: Reduced precipitation recycling
- Savannization: Grass invasion in degraded areas
Soil Paradox: Fertility in a Nutrient Desert
Pedological Characteristics
- Oxisols/Ultisols: 100+ million years old
- Laterization: Iron/aluminum oxide accumulation
- Rapid cycling: 90% nutrients in biomass
Agricultural Challenges
- Yield decline: 75% drop after 3 years of cultivation
- Terra preta: Ancient anthropogenic black soils
- Sustainable alternatives:
- Agroforestry systems
- Perennial polycultures
- Analog forestry
Indigenous Stewardship: Traditional Ecological Knowledge
Sustainable Practices
- Chagra systems: Cyclical polycultures
- Rotational hunting: 12% of territory used at once
- Fire management: Cool burns prevent wildfires
Cultural Importance
- 8,000+ endemic languages
- 40% of remaining forest under indigenous management
- 300+ tribes in Brazilian Amazon alone
Conservation Solutions: Multi-Pronged Approaches
Protection Strategies
1. Legal Mechanisms
- REDD+ carbon financing
- Debt-for-nature swaps
- Indigenous land titling
2. Technological Tools
- Real-time deforestation monitoring (GLAD alerts)
- DNA barcoding for timber tracking
- Bioacoustic monitoring networks
3. Economic Alternatives
- Non-timber forest products
- Ecotourism certification
- Carbon credit markets
Global Climate Impacts
Potential Consequences
- Rainfall reduction: 40% decline in Amazon precipitation
- Carbon release: 200 billion tons if all tropics deforested
- Species extinction: 50,000+/year at current rates
Positive Feedbacks
- Albedo changes: Pasture reflects more sunlight
- Methane emissions: Flooded reservoirs in hydro projects
- Disease vectors: Deforestation increases malaria risk
Call to Action: Why Protection Matters
Individual Contributions
- Reduce beef consumption
- Choose FSC-certified wood
- Support indigenous rights organizations
- Advocate for supply chain transparency
Institutional Changes Needed
- Eliminate agricultural subsidies driving expansion
- Strengthen cross-border enforcement
- Invest in green infrastructure
Grassland:
The steppe biome represents one of Earth’s most expansive yet underappreciated ecosystems, spanning vast continental interiors where precipitation is too limited for forests but sufficient to prevent desertification. These golden grasslands play critical roles in:
- Global carbon storage in deep root systems
- Supporting unique grazing ecosystems
- Maintaining continental climate patterns
- Preserving ancient human cultural landscapes
Global Distribution
Steppes form a nearly continuous belt across:
- Eurasian Steppe (Ukraine to Mongolia – the world’s largest)
- Great Plains (North America)
- Patagonian Steppe (South America)
- Highveld (Southern Africa)
- Australian Rangelands
Climate Characteristics
- Precipitation: 250-500 mm annually
- Temperature Range: -40°C to 40°C (-40°F to 104°F)
- Growing Season: 90-150 days
- Key Features:
- Strong seasonal variability
- Frequent drought cycles
- Intense wind exposure
Vegetation Profile
Dominant Grass Species
Grass Type | Characteristics | Ecological Role |
Feather Grass (Stipa) | Silvery seed heads | Drought-resistant |
Fescue (Festuca) | Deep root systems | Soil stabilizer |
Blue Grama (Bouteloua gracilis) | Short, nutritious | Bison preferred forage |
Wooded Steppe Transition
- Occurs at 400-600mm precipitation
- Features islands of trees:
- Siberian larch (Larix sibirica)
- Mongolian oak (Quercus mongolica)
- Juniper woodlands
Wildlife Adaptations
Mammals
- Saiga antelope: Nose filters dust/warms air
- Steppe marmot: Complex burrow systems
- Przewalski’s horse: Last wild horse species
Birds
- Demoiselle crane: Long-distance migrant
- Great bustard: World’s heaviest flying bird
- Saker falcon: High-speed grassland hunter
Ecological Challenges
- Overgrazing: Leads to desertification
- Plough conversion: 60% of original steppe lost
- Species decline: Saiga populations dropped 95%
Savanna Biome: Where Grass and Trees Dance
Introduction to Tropical Grasslands
Savannas represent nature’s perfect balance between forest and grassland, characterized by:
- Distinct wet/dry seasons
- Fire-adapted ecosystems
- Iconic megafauna
- Ancient human coexistence
Global Distribution
Major savanna regions include:
- African Savanna (Serengeti to Sahel)
- Cerrado (Brazil)
- Northern Australia
- Llanos (Venezuela/Colombia)
Climate Patterns
- Rainfall: 800-1,500 mm annually
- Seasons:
- 4-8 month wet season
- 4-8 month dry season
- Temperature: 20-30°C year-round
Vegetation Dynamics
Tree Adaptations
Feature | Purpose | Example Species |
Thick bark | Fire resistance | Baobab (Adansonia) |
Water storage | Drought survival | Bottle tree (Brachychiton) |
Small leaves | Reduce transpiration | Acacia (Vachellia/Senegalia) |
Umbellate crowns | Wind resistance | Umbrella thorn (Vachellia tortilis) |
Grass Layer
- Elephant grass (Pennisetum purpureum): Grows 4m tall
- Red oat grass (Themeda triandra): Fire-adapted
- Kangaroo grass (Themeda australis): Australian native
Fauna of the Savanna
Megafauna
- African elephant: Landscape engineers
- Giraffe: Specialized browsing
- White rhino: Grazing specialists
Predators
- Lion: Social hunting strategies
- Cheetah: Speed-adapted hunting
- African wild dog: Cooperative packs
Ecological Engineers
- Termites: Build nutrient-rich mounds
- Dung beetles: Nutrient recyclers
- Quelea birds: Most numerous bird species
Fire Ecology
Benefits of Controlled Burns
- Nutrient cycling: Releases minerals
- Tree/grass balance: Prevents woodland encroachment
- Pest control: Reduces tick populations
- New growth: 30% more protein in fresh grass
Fire Adaptations
- Grasses: Grow from base (apical meristem protection)
- Trees: Epicormic buds under bark
- Animals: Burrowing or rapid movement
Comparative Analysis
Feature | Steppe | Savanna |
Climate | Temperate | Tropical |
Tree Cover | 0-10% | 10-30% |
Primary Grazers | Bison, antelope | Zebra, wildebeest |
Fire Frequency | 5-15 years | 1-3 years |
Soil Type | Chernozem (black earth) | Lateritic (iron-rich) |
Human Use | Wheat cultivation | Pastoralism |
Conservation Challenges
Shared Threats
- Climate change: Altered rainfall patterns
- Agricultural expansion: 40% converted globally
- Invasive species: Cheatgrass in steppes
Protection Strategies
- Community conservancies (Africa)
- Sustainable grazing plans
- Carbon credit programs
Ecological Services
- Carbon storage: Deep grassland soils
- Water filtration: Natural flood control
- Biodiversity: Last refuge for megafauna
Desert Biome:
Desert vegetation represents one of nature’s most remarkable examples of evolutionary adaptation, where plants have developed extraordinary strategies to thrive in Earth’s harshest environments. Across both hot deserts (Sahara, Sonoran) and cold deserts (Gobi, Patagonia), xerophytic plants demonstrate incredible resilience through specialized:
- Water conservation mechanisms
- Temperature regulation systems
- Reproductive strategies
- Soil stabilization techniques
These adaptations allow desert flora to survive where annual precipitation rarely exceeds 250mm (10 inches) and temperature fluctuations can span 50°C (90°F) in a single day.
Global Distribution of Desert Flora
Major Desert Regions and Their Signature Plants
Desert Region | Climate Type | Iconic Species | Unique Adaptation |
Sonoran (North America) | Hot | Saguaro cactus | Pleated stem expansion |
Sahara (Africa) | Hot | Date palm | Deep taproots (30m+) |
Atacama (South America) | Cool coastal | Tillandsia air plants | Fog harvesting |
Gobi (Asia) | Cold | Saxaul shrub | Salt-excreting leaves |
Great Victoria (Australia) | Hot | Spinifex grass | Resin-coated leaves |
Structural Adaptations: Desert Plant Architecture
Water Storage Systems
- Succulent stems: Saguaro can store 1,500+ liters of water
- Tuberous roots: Desert gourds develop 50kg water reservoirs
- Folded structures: Pleated cacti expand during rare rains
Leaf Modifications
Leaf Type | Example Species | Advantage |
Spines | Barrel cactus | Reduces surface area |
Waxy coating | Creosote bush | Reflects sunlight |
Hairy surfaces | Desert marigold | Traps moisture |
Vertical orientation | Joshua tree | Minimizes midday sun exposure |
Root Systems: The Hidden Network
- Taproots: Penetrate 15-30m deep (mesquite trees)
- Lateral roots: Span 20m+ horizontally (palo verde)
- Dual systems: Combine deep and shallow roots (jujube)
Physiological Adaptations: Survival Biochemistry
Photosynthesis Variations
1. CAM Photosynthesis
- Stomata open only at night
- 90% water use efficiency (vs 5% in normal plants)
- Examples: Agave, most cacti
2. C4 Photosynthesis
- Specialized leaf anatomy
- Higher temperature tolerance
- Examples: Bermuda grass, tumbleweed
Drought Response Mechanisms
- Rapid germination: Ephemerals complete lifecycle in 2-3 weeks
- Dormancy: Resurrection plants survive years without water
- Leaf shedding: Ocotillo drops leaves within 24h of drought
Reproductive Strategies: Ensuring Future Generations
Seed Adaptations
- Fire-activated: Some acacias require 120°F+ to germinate
- Delayed germination: Desert lupine seeds viable for 50+ years
- Water-soluble inhibitors: Wash away only in substantial rains
Pollination Partnerships
- Night-blooming: Attracts bats/moths (saguaro flowers)
- Precise timing: Flowers open for single days
- Deceptive mimics: Some orchids imitate female bees
Ecological Roles of Desert Flora
Microclimate Creation
- Nurse plants: Palo verde shelters young cacti
- Temperature moderation: Shade reduces soil temp by 20°C
- Dew collection: Tamarisk branches channel condensation
Soil Conservation
- Windbreaks: Mesquite stands reduce erosion
- Cryptobiotic crusts: Cyanobacteria networks (supported by shrubs)
- Nutrient cycling: Desert lavender enriches poor soils
Human Uses of Desert Plants
Traditional Applications
- Food: Pinyon pine nuts (30% protein)
- Medicine: Hoodia appetite suppression
- Materials: Yucca fiber for ropes/baskets
Modern Innovations
- Biofuels: Jojoba oil substitutes for whale oil
- Pharmaceuticals: Cancer drugs from maytenus
- Architecture: Cactus-inspired water collection
Climate Change Impacts
Vulnerabilities
- Shifted rainfall patterns: Disrupting germination cycles
- Increased wildfires: Destroying slow-growing species
- Invasive species: Buffelgrass outcompeting natives
Resilience Demonstrations
- Ancient survivors: Welwitschia (2,000+ year lifespan)
- Range expansion: Some species moving poleward
- Hybrid vigor: New crosses showing drought tolerance
Conservation Efforts
Protection Initiatives
- Desert Botanical Garden (Phoenix): 50,000+ specimens
- UNESCO Biospheres: Desierto de Altar reserve
- Seed banks: Millennium Seed Project stores 2.4 billion seeds
Citizen Science Opportunities
- Phenology tracking: Monitoring bloom times
- Restoration volunteering: Joshua Tree National Park
- Camera traps: Documenting pollinator activity
The Economics of Ecosystems and Biodiversity (TEEB):
The Economics of Ecosystems and Biodiversity (TEEB) represents one of the most ambitious international efforts to systematically quantify and value nature’s contributions to human wellbeing. Launched in 2007 under the German G8 Presidency and hosted by the United Nations Environment Programme (UNEP), this groundbreaking initiative was spearheaded by renowned Indian environmental economist Pavan Sukhdev, former Director of the Deutsche Bank’s Global Markets business.
Historical Context and Launch
TEEB emerged during a period of growing recognition that:
- Biodiversity loss was accelerating at unprecedented rates
- Economic systems failed to account for natural capital depletion
- Policy decisions routinely undervalued ecosystem services
- Business models ignored environmental externalities
The initiative built upon earlier work like the Millennium Ecosystem Assessment (2005) but focused specifically on developing practical economic tools and frameworks for decision-makers.
Core Objectives and Framework
Three Pillars of TEEB’s Mission
1. Valuation Framework Development
- Create standardized methodologies for natural capital accounting
- Establish protocols for ecosystem service valuation
- Develop metrics for biodiversity measurement
2. Policy Integration
- Mainstream ecological economics into government decision-making
- Reform national accounting systems (beyond GDP)
- Design market mechanisms for conservation financing
3. Awareness Building
- Communicate the economic case for biodiversity
- Highlight costs of inaction
- Showcase successful valuation applications
Phase-Based Implementation
Phase | Years | Focus Area | Key Outputs |
TEEB Interim Report | 2008 | Conceptual Foundations | Initial valuation approaches |
TEEB Climate Issues Update | 2009 | Climate-Biodiversity Links | REDD+ economic analysis |
TEEB Final Report | 2010 | Comprehensive Framework | 5 target audience reports |
TEEB Implementation | 2011-2015 | Country Applications | 40+ national initiatives |
TEEB for Agriculture & Food | 2018 | Agri-food Systems | True cost accounting methods |
Key Findings and Revelations
Economic Value of Biodiversity
TEEB’s research quantified that:
- Coral reefs provide $172 billion annually in services
- Forests contribute $5 trillion yearly to the global economy
- Pollinator services are worth $190-310 billion per year
- Wetlands deliver $70 trillion in value globally
Costs of Biodiversity Loss
The initiative documented alarming trends:
- $2-4.5 trillion annual loss from deforestation
- 30% decline in ecosystem services since 1990
- 50,000 species going extinct yearly (100-1,000x background rate)
- 6th Mass Extinction currently underway
The TEEB Reports Series
1. TEEB for Policy Makers (2010)
- Presented cost-benefit analysis tools
- Showcased 100+ policy success stories
- Introduced the “TEEB Approach” to valuation
2. TEEB for Local Administrators (2010)
- Focused on urban and regional planning
- Featured green infrastructure case studies
- Provided municipal decision-support tools
3. TEEB for Business (2010)
- Analyzed risks in 13 key sectors
- Identified $2-6 trillion in business opportunities
- Developed the Natural Capital Protocol precursor
4. TEEB for Citizens (2010)
- Translated complex economics for public
- Highlighted individual connections to nature
- Provided actionable conservation steps
5. TEEB Synthesis Report (2010)
- Integrated all findings
- Presented 10-point action plan
- Launched global implementation strategy
Methodological Innovations
The TEEB Valuation Framework
1. Recognize Value
- Identify ecosystem services
- Map service providers/beneficiaries
2. Demonstrate Value
- Quantify biophysical flows
- Apply appropriate valuation methods
3. Capture Value
- Design policy instruments
- Create market mechanisms
4. Mainstream Value
- Integrate into accounting systems
- Reform economic indicators
Valuation Typology
Value Type | Measurement Approach | Example |
Direct Use | Market prices | Timber sales |
Indirect Use | Replacement costs | Flood protection |
Option Value | Contingent valuation | Future medicines |
Non-Use Value | Willingness-to-pay | Species existence |
Global Impact and Legacy
Policy Influence
TEEB directly contributed to:
- UN System of Environmental-Economic Accounting (SEEA)
- Aichi Biodiversity Targets (2011-2020)
- EU Biodiversity Strategy 2020
- Natural Capital Declaration (2012)
National Implementations
Over 40 countries launched TEEB-inspired programs:
- India: Green GDP pilot projects
- Brazil: Amazon valuation initiatives
- South Africa: Ecosystem service maps
- Germany: Landscape accounting systems
Corporate Adoption
Major business impacts include:
- Natural Capital Coalition formation
- Trucost environmental accounting
- WBCSD biodiversity measurement tools
- GRI sustainability reporting standards
Critical Analysis and Challenges
Success Factors
1. Credible Leadership: Pavan Sukhdev’s financial sector background
2. Timely Launch: Coincided with 2008 financial crisis rethinking
3. Multidisciplinary Approach: Bridged ecology-economics divide
4. Practical Orientation: Focused on decision-maker needs
Limitations and Critiques
- Valuation complexities in cultural/spiritual services
- Implementation gaps between national and local levels
- Corporate greenwashing risks
- North-South equity concerns in application
Current Status and Future Directions
TEEB’s Evolution
The initiative has expanded into specialized streams:
- TEEB for Agriculture & Food (2018)
- TEEB for Water & Wetlands (2013)
- TEEB for Cities (2021)
1. Digital Environmental Accounting
- Blockchain for nature assets
- AI-powered ecosystem monitoring
- Satellite-based valuation
2. Climate-Biodiversity Nexus
- Nature-based solutions valuation
- Blue carbon economics
- REDD++ frameworks
3. Financial System Reform
- Central bank natural capital mandates
- Biodiversity stress testing
- Green bond standards
Key Takeaways for Stakeholders
For Governments
- Adopt natural capital accounting
- Reform perverse subsidies ($1.8 trillion/year)
- Implement payment for ecosystem services
For Businesses
- Assess supply chain dependencies
- Disclose nature-related risks (TNFD)
- Innovate nature-positive solutions
For Civil Society
- Advocate for proper valuation
- Support citizen science initiatives
- Educate about nature’s economic value
Payment for Ecosystem Services (PES):
The fragile Himalayan ecosystem, often called the “Third Pole,” provides irreplaceable services to nearly 2 billion people across South Asia. Recognizing this critical role, Himalayan states have championed the Green Bonus concept—a Payment for Ecosystem Services (PES) mechanism that compensates mountain communities for preserving:
- Water towers feeding 10 major river systems
- Carbon sinks storing 10% of global forest carbon
- Biodiversity hotspots with 10,000+ plant species
- Climate regulators influencing monsoon patterns
Evolution of India’s Forest-Based Fiscal Transfers
Constitutional Framework
- Article 275(1): Provides special grants for forest preservation
- Forest Rights Act, 2006: Recognizes community conservation
- National Forest Policy, 1988: Mandates 33% forest cover
Finance Commission Milestones
Commission | Period | Forest Weight | Allocation | Himalayan Impact |
12th FC | 2005-10 | 0% | – | No recognition |
13th FC | 2010-15 | Formula-based | ₹5,000 crore | First PES mechanism |
14th FC | 2015-20 | 7.5% | Tax pool share | Limited benefits |
15th FC | 2021-26 | 10% | Largest PES globally | Game-changing potential |
The Himalayan Case for Green Bonus
Ecological Services Provided
1. Water Security
- Feeds Ganges, Brahmaputra, Indus basins
- Regulates water for 600 million downstream users
- Maintains 15,000+ glaciers
2. Climate Regulation
- Stores 4.6 billion tons of carbon
- Acts as monsoon “anchor”
- Cools regional temperatures
3. Biodiversity Conservation
- 50% of India’s flowering plants
- Endangered species like snow leopards
- 35% of medicinal plants
Economic Constraints
- Development limitations: 65% area under forest/tree cover
- Opportunity costs: Estimated ₹12,000 crore/year in foregone development
- Climate vulnerability: 30%+ GDP at risk from ecological decline
Global Context of PES Systems
International Precedents
Country | Program | Annual Budget | Key Features |
Costa Rica | PSA | $30 million | 25+ year success |
China | SLCP | $40 billion | World’s largest |
Mexico | PHS | $60 million | Watershed focus |
India | Green Bonus | ₹4.5 trillion | Potential global leader |
Why Himalayan PES Matters Globally
- Scale: Affects 20% of humanity
- Innovation: Integrates federal finance with ecology
- Replicability: Model for Andes, Alps, other mountain regions
Implementation Challenges
Structural Issues
1. Weightage Conflict
- Population (15%) vs. Forests (10%)
- Area (15%) vs. Ecological sensitivity
2. Measurement Gaps
- Forest quality vs. quantity debate
- No premium for high-altitude forests
- Excludes non-forest ecosystems (grasslands, wetlands)
3. Equity Concerns
- Low-population states disadvantaged
- Historical conservation not rewarded
- Tribal communities often excluded
Himalayan State Perspectives
State | Forest Cover | 14th FC Share | Key Demands |
Himachal | 66% | 0.7% | Higher weight for alpine zones |
Uttarakhand | 71% | 0.8% | Glacier protection premium |
Sikkim | 82% | 0.2% | Organic farming compensation |
Arunachal | 80% | 0.4% | Indigenous conservation credit |
The 15th Finance Commission Breakthrough
Key Innovations
1. Increased Weightage
- 10% for forest cover (from 7.5%)
- Additional 2.5% for density
2. Performance-Based
- 60% current forest cover
- 40% incremental improvement
3. New Parameters
- Tiger/elephant corridors
- Protected area management
- Water yield potential
Projected Impacts
Metric | 14th FC Baseline | 15th FC Potential |
Himalayan allocation | ₹8,000 crore | ₹15,000+ crore |
Forest cover incentive | 12 states | All 28 states |
Global ranking | 5th in PES | Potential #1 |
Policy Recommendations
Immediate Reforms
1. Himalayan Differential
- 15% weight for mountain forests
- Glacier protection premium
2. Expanded Parameters
- Water provision metrics
- Carbon sequestration values
- Biodiversity indices
3. Direct Community Benefits
- 30% funds to village councils
- Conservation livelihood programs
- Eco-development corporations
Long-Term Vision
1. Transboundary PES
- South Asian water fund
- Regional carbon market
2. Green GDP Accounting
- State-level natural capital budgets
- Ecological deficit/surplus tracking
3. Global Leadership
- Export PES model worldwide
- Host international mountain PES summit
Case Studies: Local Success Stories
1. Himachal’s Carbon Credits
- Project: 500 MW clean energy from forest protection
- Revenue: ₹120 crore/year from carbon markets
- Benefit: Funds 20,000 women-led nurseries
2. Sikkim’s Organic Bonus
- Policy: 100% organic farming since 2016
- PES Link: ₹50 crore/year for pesticide-free zones
- Outcome: 30% premium for organic products
3. Uttarakhand’s Water Funds
- Mechanism: Downstream users pay upstream villages
- Scale: ₹18 crore/year from 5 cities
- Impact: 50,000 ha forests protected
Future Pathways
Technological Integration
- Blockchain: Transparent PES flows
- Remote Sensing: Real-time forest monitoring
- AI Modeling: Predictive valuation
Financial Innovations
- Green Bonds: State-level issuances
- Eco-Tourism Royalties: 5% revenue share
- Corporate Stewardship: CSR partnerships
Global Climate Finance
- REDD+: $5 billion potential
- Adaptation Funds: WB/Green Climate Fund
- Biodiversity Credits: Emerging market
Global Initiatives on Ecosystem Services
Ecosystem services have transitioned from academic concept to policy imperative, gaining unprecedented recognition in international frameworks and national accounting systems. This paradigm shift reflects growing awareness that 51% of global GDP ($44 trillion) is moderately or highly dependent on nature (WEF 2020). The policy evolution encompasses:
- International treaties incorporating natural capital valuation
- Innovative financial mechanisms for conservation
- Alternative economic indicators beyond GDP
- Pioneering regional implementations
Landmark Global Policy Developments
Nagoya Protocol (2010): A Watershed Moment
The COP10 Conference on Biological Diversity in Nagoya marked several breakthroughs:
1. Aichi Target 2: Mandated integration of biodiversity values into national accounting by 2020
2. Article 10: Specifically addressed environmental goods and services valuation
3. Implementation Mechanisms:
- 94% of parties developed national biodiversity strategies
- 68 nations initiated natural capital accounting
- $30 billion pledged for conservation financing
Key Outcomes:
Indicator | Pre-2010 Status | Post-Nagoya Progress |
Countries with NCA | 12 | 89 (as of 2023) |
Annual conservation funding | $3 billion | $22 billion |
Corporate disclosures | 5% Fortune 500 | 43% in 2023 |
Case Study: The Amazon Fund Controversy
Program Overview
- Established: 2008
- Capitalization: $1.3 billion (94% Norway, 5% Germany)
- Managed by: Brazilian Development Bank (BNDES)
- Achievements:
- Reduced deforestation by 83% (2004-2012)
- Supported 103 conservation projects
- Preserved 4.2 million hectares
Governance Crisis (2019)
- Brazil’s Proposal: Redirect funds to compensate landowners
- Donor Concerns: Violation of REDD+ principles
- Outcome:
- Norway/Germany suspended $72 million
- Fund operations frozen until 2023
- Deforestation spiked 75% during impasse
Lessons Learned
1. Conditionality Matters: Performance-based payments require robust safeguards
2. Local Ownership: 60% projects lacked indigenous participation
3. Transparency: Independent audits prevented misuse
Beyond GDP: New Economic Paradigms
Gross Environmental Product (GEP)
Concept: Quantifies ecosystem services in monetary terms
Implementation Examples:
Region | Focus | Valuation Method | Key Findings |
China (Qinghai) | Alpine ecosystems | InVEST modeling | GEP = 2.3x GDP |
Uttarakhand | Himalayan services | TEEB approach | ₹1.2 trillion/year |
Scotland | Marine resources | ONS framework | £160 billion stock |
Methodological Framework:
1. Provisioning Services: Market valuation
2. Regulating Services: Replacement cost
3. Cultural Services: Travel cost/willingness-to-pay
Green GDP (GGDP)
Calculation:
GGDP = Traditional GDP – Environmental Depreciation – Resource Depletion
Global Adoption Status:
Country | Implementation Stage | Key Adjustments |
China | Pilot in 31 provinces | 3.8% GDP reduction |
India | Committee formed 2023 | Forest cover impact |
EU | Satellite accounts | Carbon intensity |
Challenges:
- Data gaps in ecosystem service valuation
- Political resistance to “reduced” growth figures
- Lack of standardized methodologies
Bhutan’s Gross National Happiness (GNH) Model
Four Pillar Framework
1. Sustainable Development
- 60% forest cover mandate
- Carbon negative status
- 100% renewable electricity
2. Cultural Preservation
- Traditional medicine coverage
- Heritage site protection
- Language revitalization
3. Good Governance
- Environmental impact assessments
- Conservation trust fund
- Climate adaptation planning
4. Ecological Resilience
- Biological corridors (51% territory)
- Sustainable tourism levy
- Watershed protection payments
5. Quantitative Metrics
- 33 indicator dashboard
- Annual GNH surveys
- Policy screening tool
Impact:
- 2.5% annual GDP growth alongside conservation
- 98% population reports “happy” or “very happy”
- Tourism revenue up 300% since 2010
Uttarakhand’s Natural Capital Leadership
GEP Implementation
1. Valuation Scope:
- 10 ecosystem types
- 24 service categories
- District-level assessments
2. Key Findings:
- Annual GEP: ₹1.24 trillion (1.7x GSDP)
- Water provisioning: ₹48,000 crore
- Carbon sequestration: ₹32,000 crore
3. Policy Applications:
- Eco-sensitive zone designations
- Hydropower royalty revisions
- Forest fire management budgets
Innovative Instruments
- Water User Charges: 0.5% on hydro projects
- Carbon Credits: 2 million tons/year potential
- Biodiversity Certificates: Panchayat-level trading
Comparative Policy Analysis
Framework | Coverage | Valuation Approach | Policy Leverage |
GEP | Ecosystem services | Monetary/physical | Development planning |
GGDP | National accounts | GDP adjustment | Macroeconomic policy |
GNH | Holistic wellbeing | Index composite | Quality-of-life focus |
Emerging Global Trends
1. Natural Capital Accounting Acceleration
- UN SEEA EA: 89 countries implementing
- TNFD Adoption: 230 financial institutions piloting
- Central Bank Mandates: ECB climate stress tests
2. Innovative Financing
- Debt-for-Nature Swaps: $3 billion in 2023
- Biodiversity Credits: $8 billion market by 2030
- Blue Bonds: $5 billion issued since 2018
3. Corporate Integration
- Science-Based Targets for Nature: 1,200+ companies
- Nature-Related Disclosures: SEC climate rules
- Supply Chain Valuations: Agri-food sector leaders
Implementation Challenges
Technical Barriers
- Data resolution limitations
- Non-market valuation complexities
- Ecosystem service trade-off analysis
Political Economy Constraints
- Short-term vs long-term tradeoffs
- Special interest opposition
- Interjurisdictional coordination
Equity Considerations
- Indigenous knowledge integration
- Benefit sharing mechanisms
- Just transition frameworks
Future Policy Directions
1. Mainstreaming Natural Capital
- G7/G20 accounting standards
- IMF surveillance inclusion
- WTO trade rule integrations
2. Next-Generation Metrics
- AI-powered real-time valuation
- Space-based ecosystem monitoring
- Blockchain-enabled PES systems
3. Institutional Innovations
- Ministries of Natural Capital
- Parliamentary nature committees
- Sovereign wealth funds for conservation
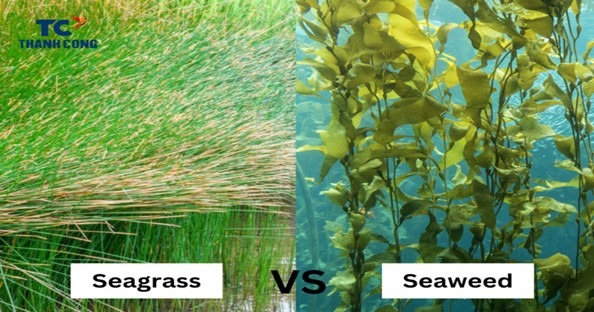
Ecosystem Services by Seagrass:
Seagrasses represent one of Earth’s most productive yet underappreciated ecosystems. These flowering plants (the only truly marine angiosperms) form extensive underwater meadows in shallow coastal waters across 159 countries, with significant concentrations in India’s Palk Strait and Gulf of Mannar. Thriving in depths of 1-10 meters, these ecological engineers transform barren seafloors into biodiversity hotspots while providing invaluable ecosystem services.
Global Distribution & Habitat Requirements
- Temperature Range: 4-35°C (optimal 15-25°C)
- Light Requirements: Minimum 11% surface light penetration
- Substrate Preference: Sandy/muddy bottoms with low wave action
- Salinity Tolerance: 10-40 ppt (parts per thousand)
Ecological Significance of Seagrass Meadows
1. Biodiversity Hotspots
- Support 40 times more marine life than bare seabeds
- Nursery grounds for 20% of major fisheries species
- Home to endangered species like:
- Dugongs (Sea cows)
- Green sea turtles
- Seahorses
- Juvenile fish populations
2. Climate Change Mitigation
Blue Carbon Superstars
Metric | Seagrass | Tropical Forest | Ratio |
Carbon sequestration rate | 83 g C/m²/yr | 28 g C/m²/yr | 3:1 |
Carbon storage capacity | 140,000 tons/km² | 50,000 tons/km² | 2.8:1 |
Carbon burial efficiency | 90% | 30% | 3:1 |
Global Impact:
- Store 18% of oceanic carbon despite covering 0.1% of seafloor
- Lock away carbon 35x faster than rainforests
- Preserve carbon for millennia in anaerobic sediments
3. Coastal Protection
- Wave energy reduction: Up to 50% in dense meadows
- Erosion control: Stabilize sediments with 3km root systems
- Storm surge mitigation: Save $230 million annually in flood prevention
4. Water Purification
- Nutrient cycling: Process 1kg N/ha/day
- Sediment trapping: 4x clearer water than adjacent areas
- Pathogen removal: 50% reduction in microbial loads
5. Economic Value
Service | Value (per ha/year) | Global Total |
Fisheries support | $3,500 | $350 billion |
Carbon storage | $2,800 | $2.8 trillion |
Tourism/recreation | $1,200 | $120 billion |
Threats to Seagrass Ecosystems
Anthropogenic Pressures
1. Coastal Development
- 30% global loss since 1900
- Dredging destroys root systems
2. Water Quality Degradation
- Eutrophication causes algal blooms
- 1mg/L nutrient increase → 50% light reduction
3. Climate Change Impacts
- 5°C rise could eliminate 90% of meadows
- Ocean acidification impairs calcifying associates
4. Destructive Fishing
- Trawling scars persist for decades
- 1 pass removes 40% vegetation
5. Conservation Status
- Declining at 7% annually (faster than coral reefs)
- Only 26% of seagrass areas are protected
- 14 species considered endangered
Seagrass Conservation Strategies
1. Protection Measures
- Marine Protected Areas with no-take zones
- Anchor bans in sensitive meadows
- Setback regulations for coastal construction
2. Restoration Techniques
Method | Success Rate | Cost (per ha) |
Seed broadcasting | 40-60% | $8,000 |
Sprig planting | 60-80% | $15,000 |
Sod transplantation | 80-95% | $25,000 |
3. Community Engagement
- Dugong conservation programs
- Citizen science monitoring
- Eco-tourism initiatives
4. Policy Interventions
- Blue Carbon credit systems
- Water quality standards enforcement
- Fisheries management plans
Indian Context: Gulf of Mannar & Palk Strait
Ecological Importance
- 3,500 km² of seagrass meadows
- 7 species including Halophila ovalis and Thalassia hemprichii
- 500+ dugong population (10% of global total)
Conservation Challenges
- Shrimp farming expansion
- Coral mining activities
- Industrial effluent discharge
Success Stories
1. Gulf of Mannar Biosphere Reserve
- 30% reduction in destructive fishing
- 15% meadow recovery since 2010
2. Tamil Nadu Coastal Restoration
- 200 ha restored since 2018
- 25% increase in fish catches
Future Research Priorities
1. Technological Innovations
- Satellite monitoring of meadow health
- E-DNA techniques for biodiversity assessment
- AI-powered restoration planning
2. Climate Adaptation
- Heat-resistant cultivars
- Assisted migration strategies
- Hybrid stabilization structures
3. Economic Valuation
- Blue carbon accounting frameworks
- Payment for ecosystem services
- Sustainable finance mechanisms
Call to Action
Individual Contributions
- Reduce fertilizer use to prevent runoff
- Choose sustainable seafood
- Support marine conservation NGOs
Policy Recommendations
1. National Seagrass Monitoring Program
2. Coastal Development Impact Fees
3. Blue Carbon Inclusion in NDCs
Threats:
Seagrass meadows, among the most productive ecosystems on Earth, face mounting threats from both natural disturbances and human activities. These underwater prairies—critical for carbon sequestration, coastal protection, and marine biodiversity—are declining globally at an alarming rate of 7% annually (equivalent to losing two football fields every hour). Understanding these threats is essential for developing effective conservation strategies.
Natural Disturbances Affecting Seagrass Health
1. Grazing Pressure
Primary Grazers:
- Dugongs: Consume 30kg/day, creating feeding trails
- Green sea turtles: 2kg/day grazing, selective feeding
- Herbivorous fish: Parrotfish, rabbitfish
Ecological Impacts:
Grazer Type | Effect | Recovery Time |
Light grazing | Promotes new growth | Weeks |
Moderate grazing | Patchy meadows | 1-2 years |
Overgrazing | Complete meadow loss | Decadal recovery |
Adaptation Strategies:
- Compensatory growth: Some species regrow 5x faster after grazing
- Chemical defenses: Phenolic compounds deter herbivores
- Structural complexity: Tough rhizome mats resist uprooting
2. Storm and Wave Damage
Physical Impacts:
- Sediment scouring: Removes 10-30cm of substrate
- Plant uprooting: Breaks rhizome networks
- Light reduction: Suspended sediments block photosynthesis
Case Study: Hurricane Impacts
- Katrina (2005): Destroyed 400km² of seagrass in Florida
- Recovery rates: 5-10 years for complete meadow restoration
Resilience Factors:
- Meadow density: Dense beds lose only 20% vs 80% in sparse areas
- Species type: Thalassia more resistant than Halophila
- Water depth: Shallow (<3m) most vulnerable
3. Desiccation Stress
Vulnerability Windows:
- Spring tides: 2-4 hour exposures critical
- Heat waves: Combined with low tides = 90% mortality
Physiological Effects:
- Oxidative damage: Lipid peroxidation in leaves
- Osmoregulation failure: 40% water loss lethal
- Photosynthetic shutdown: Beyond 6 hours exposure
Survival Adaptations:
- Waxy cuticles: Reduce evaporation
- Sucrose accumulation: Cellular protection
- Aerenchyma tissue: Oxygen storage
Human-Induced Threats to Seagrass Ecosystems
1. Eutrophication: The Silent Killer
Mechanism of Damage:
1. Nutrient Loading (N/P from agriculture, sewage)
2. Algal Blooms (Macroalgae/Phytoplankton)
3. Light Limitation (90% reduction possible)
4. Hypoxic Conditions (<2mg/L O₂)
5. System Collapse (Seagrass die-off)
Quantitative Impacts:
Nutrient Level | Effect | Timeframe |
2x background | 30% growth reduction | 1 season |
5x background | 50% meadow loss | 2-3 years |
10x background | Complete collapse | <5 years |
Global Hotspots:
- Baltic Sea: 60% loss since 1900
- Chesapeake Bay: 90% reduction
- East China Sea: 450km² degraded
2. Physical Habitat Destruction
Primary Drivers:
- Dredging: 1m³ sediment removal kills 10m² meadow
- Boating: Prop scars persist 15-20 years
- Coastal construction: 80% loss near urban areas
Impact Comparison:
Activity | Immediate Loss | Long-Term Effect |
Trawling | 40% removal | 10yr recovery |
Anchor damage | 5m²/scar | No natural recovery |
Land reclamation | 100% loss | Irreversible |
3. Overfishing and Trophic Cascades
Ecological Chain Reactions:
1. Predator removal (e.g., sharks)
2. Mesopredator release (e.g., rays)
3. Herbivore decline (e.g., parrotfish)
4. Algal overgrowth → Seagrass smothering
Fisheries Data:
- Mediterranean: 60% seagrass decline linked to overfishing
- Australia: Turtle exclusion nets increase seagrass 300%
Eutrophication: The Deadly Cascade
Stage 1: Nutrient Loading
Primary Sources:
- Agricultural runoff: 60% of nitrogen inputs
- Wastewater: 25% of coastal phosphorus
- Atmospheric deposition: 15% of total N
Global Inputs:
- Nitrogen: 150 Tg/yr (pre-industrial: 30 Tg)
- Phosphorus: 15 Tg/yr (3x natural levels)
Stage 2: Algal Response
Bloom Dynamics:
- Phytoplankton: 100-1000x population increase
- Epiphytes: 5mg/cm² reduces photosynthesis 90%
- Macroalgae: Canopy heights >50cm block light
Growth Rates:
Algae Type | Doubling Time | Maximum Biomass |
Diatoms | 1-2 days | 200mg C/m³ |
Dinoflagellates | 3-5 days | 500mg C/m³ |
Ulva | 5-7 days | 20kg/m² |
Stage 3: System Collapse
Biochemical Changes:
- Daytime O₂: Super-saturation (150%)
- Nighttime O₂: Near zero (anoxia)
- Sediment H₂S: >1mM lethal to roots
Mortality Thresholds:
- Light: <5% surface irradiance for 30 days
- Oxygen: <1mg/L for 72 hours
- Sulfide: >300μM in rhizosphere
Conservation Solutions and Management
Eutrophication Control
1. Watershed Management
- Buffer strips (30m reduces N by 60%)
- Wetland restoration (1ha processes 500kg N/yr)
2. Wastewater Treatment
- Advanced nutrient removal ($0.50/person/day)
- Shellfish aquaculture (1 oyster filters 50gal/day)
3. Agricultural Reforms
- Precision fertilization (30% less N usage)
- Cover cropping (50% runoff reduction)
Physical Protection Measures
- Boating regulations: No-anchor zones, propeller guards
- Dredging controls: Seasonal restrictions, depth limits
- Marine spatial planning: Seagrass priority areas
Restoration Techniques
Method | Success Rate | Cost/ha | Key Species |
Transplants | 70% | $25,000 | Thalassia, Posidonia |
Seed bombs | 40% | $8,000 | Zostera, Halodule |
Natural recovery | 90% | Minimal | All (with protection) |
Global Case Studies
Success: Tampa Bay, Florida
- Action: 60% N reduction since 1980
- Result: 5,000ha seagrass regrowth
- Economic benefit: $220 million/year fisheries boost
Failure: Bohai Bay, China
- Issue: Unchecked nutrient inputs
- Consequence: 95% seagrass loss
- Impact: $500 million/year ecosystem service loss
Emerging Research Frontiers
Climate Resilience
- Heat-tolerant cultivars: Identifying +2°C resistant strains
- Assisted migration: Introducing southern species northward
- Hybrid stabilization: Combining with oyster reefs
Novel Monitoring
- eDNA metabarcoding: Species detection from water samples
- Hyperspectral imaging: Stress detection before visible decline
- Autonomous drones: 1cm resolution mapping
Policy Recommendations
Immediate Actions
1. Seagrass Protection Acts: Legal status equivalent to forests
2. Water Quality Standards: 5m visibility minimum
3. Blue Carbon Credits: $30/ton CO₂ valuation
Long-Term Strategies
- Global Seagrass Watch: Real-time monitoring network
- International Nutrient Protocol: Binding reduction targets
- Seagrass Restoration Bonds: $10 billion global fund
Ecosystem Services by Seaweed:
Seaweeds represent some of Earth’s most ancient and ecologically significant organisms. These primitive non-flowering marine plants belong to three main groups classified by their photosynthetic pigments:
1. Chlorophyta (Green algae): 7,000 species including sea lettuce
2. Phaeophyta (Brown algae): 2,000 species including kelp
3. Rhodophyta (Red algae): 6,000 species including nori
Unlike terrestrial plants, seaweeds lack true roots, stems, and leaves, instead possessing:
- Holdfasts: Anchoring structures
- Stipes: Stem-like supports
- Blades: Leaf-like photosynthetic surfaces
- Pneumatocysts: Gas-filled floats (in some species)
Global Distribution and Habitat
Growth Zones
Zone | Depth Range | Dominant Types | Light Availability |
Supralittoral | Above high tide | Blue-green algae | Intermittent |
Intertidal | Between tides | Rockweeds, Ulva | Variable |
Subtidal | Below low tide | Kelp forests | 1-30% surface light |
Deepwater | 40-200m | Coralline algae | <1% surface light |
Key Global Habitats
- Kelp forests (Pacific coasts)
- Coral reef algae (Tropics)
- Estuarine communities (Mangrove areas)
- Ice-edge blooms (Polar regions)
Commercial and Nutritional Significance
Nutritional Powerhouse
Seaweeds contain 10-50 times more minerals than land plants:
Nutrient | Concentration | Health Benefit |
Iodine | 100-300mg/kg | Thyroid function |
Calcium | 500-3,000mg/100g | Bone health |
Iron | 10-50mg/100g | Blood production |
Omega-3 | 3-5% DW | Cardiovascular |
Industrial Applications
Food Industry:
- Carrageenan (red algae): $1.2 billion market (dairy stabilizer)
- Agar: $300 million (bacteriological media)
- Alginate: $400 million (thickener)
Cosmetic Uses:
- Anti-aging: Fucoidan stimulates collagen
- Moisturizing: Alginates retain water
- UV protection: Mycosporine-like amino acids
Medical Applications:
- Anticancer: Fucoxanthin induces apoptosis
- Antiviral: Sulphated polysaccharides
- Wound healing: Alginate dressings
Ecological Importance
Primary Production
- Contribute 50% of oceanic photosynthesis
- Growth rates: 0.5-1m/day (giant kelp)
- Biomass production: 2-20kg/m²/year
Habitat Formation
- Kelp forests support 800+ species
- Drift algae provide nursery grounds
- Coralline algae cement reef structures
Climate Regulation
- Carbon sequestration: 200 million tons/year
- Blue carbon storage: 630 tons C/ha in kelp
- Acidification buffering: pH stabilization
Cultivation and Harvest
Global Production Statistics
Country | Annual Yield | Main Species | Value |
China | 20 million tons | Saccharina | $8B |
Indonesia | 9 million tons | Eucheuma | $3B |
Philippines | 1.5 million tons | Gracilaria | $500M |
Farming Techniques
1. Long-line cultivation (80% of global production)
2. Raft culture (sheltered bays)
3. Seafloor planting (abalone feed)
4. Integrated systems (fish-algae polyculture)
Emerging Technologies
Biofuel Potential
- Biogas yield: 300-500L/kg VS
- Bioethanol: 0.4g/g sugar content
- Biodiesel: 20-50% lipid content
Novel Materials
- Alginate fibers: Textile industry
- Seaweed plastics: Biodegradable packaging
- Bioactive coatings: Food preservation
Conservation Challenges
Threats to Wild Stocks
- Overharvesting: 30% population declines
- Climate change: Range shifts observed
- Invasive species: Undaria spreading globally
Sustainable Management
- Rotation harvesting
- Marine protected areas
- Selective breeding programs
Future Prospects
Market Growth
- Projected CAGR: 12.5% (2023-2030)
- Global market value: $30B by 2030
- New product categories: 200+ patents annually
Research Frontiers
- Genetic modification for higher yields
- Deep-water cultivation systems
- Carbon credit programs for farms
Ecological Importance:
Ecological Superpowers of Seaweeds
Coastal Ecosystem Engineers
Nutrient Absorption:
- Removes 90% of excess nitrogen from coastal waters
- Absorbs heavy metals like lead (up to 0.5mg/g dry weight)
- Reduces harmful algal blooms by 40-60%
Carbon Sequestration Champion:
- Grows 30x faster than terrestrial plants
- Stores carbon for centuries in deep ocean sinks
- Contributes to 50% of oceanic carbon fixation
Biodiversity Boosters:
- Kelp forests support 800+ marine species
- Provide nursery grounds for 20% of commercial fish
- Increase coral reef resilience by 35%
Climate Change Mitigation
Benefit | Mechanism | Impact Scale |
CO₂ absorption | Ocean Macroalgal Afforestation (OMA) | 200 million tons/year globally |
Methane reduction | Cattle feed additive | 30-60% lower emissions |
Ocean acidification buffer | Carbonate chemistry modulation | pH stabilization in coastal zones |
India’s Seaweed Wealth: A National Assessment
Geographical Advantages
- 7,500 km coastline across 9 states
- 2.17 million km² EEZ with ideal growth conditions
- 4 major seaweed-rich zones:
1. Gulf of Mannar (Tamil Nadu)
- 147 economically important species
- 42,000 tons annual harvest potential
2. Gujarat Coast
- 200+ species identified
- Ideal for industrial alginate production
3. Lakshadweep Islands
- Pristine coral reef ecosystems
- High-value species like Kappaphycus
4. Andaman & Nicobar
- 300+ endemic species
- Untapped deepwater varieties
Commercial Species Portfolio
Species | Applications | Market Value (₹/kg) |
Gracilaria | Agar production | 50-70 |
Kappaphycus | Carrageenan | 40-60 |
Sargassum | Fertilizers, feed | 20-30 |
Ulva | Food products | 80-100 |
Turbinaria | Biofuel | 15-20 |
Industry Growth Potential
Projected Market Expansion
- Global seaweed market: $30 billion by 2030 (12.5% CAGR)
- India’s current share: <1% (₹1,200 crore)
- Realistic 2030 target: ₹15,000 crore industry
Employment Generation
- Direct jobs: 5 million in cultivation/harvesting
- Indirect jobs: 3 million in processing/marketing
- Skill development: 500+ coastal villages trainable
Critical Challenges & Solutions
1. Technological Gaps
Issues:
- Primitive drying methods (30% product loss)
- No mechanized harvesting
- Poor seed stock availability
Solutions:
- R&D Investment: Establish 4 national seaweed research centers
- Tech Transfer: Israeli floating raft systems
- Quality Control: 20 regional processing hubs
2. Labor & Livelihood Concerns
Problems:
- Daily wages only ₹200-300
- Seasonal migration of workers
- Hazardous diving practices
Interventions:
- Minimum support price: ₹50/kg for farmers
- Safety gear: Government subsidies
- Women SHGs: 75% workforce potential
3. Market Development
Barriers:
- 90% Indians unaware of seaweed benefits
- Limited domestic demand
- Export quality inconsistencies
Strategies:
- National awareness campaign
- FPO-led value addition
- Export certification programs
4. Environmental Sustainability
Risks:
- Overharvesting of wild stocks
- Invasive species introduction
- Habitat destruction
Management:
- Zonal harvesting bans
- Cultivation-only zones
- EIA for large farms
Policy Framework for Growth
Immediate Priorities
1. National Seaweed Mission 2.0
- ₹500 crore allocation
- Focus on cultivation technologies
2. Marine Spatial Planning
- Designate seaweed farming zones
- 5,000 ha allocated by 2025
3. Farmer Incentives
- 50% subsidy on inputs
- Crop insurance schemes
- KCC loans for seaweed growers
Long-Term Vision
- India as global seaweed leader by 2040
- Carbon credit programs for OMA
- Blue economy contribution of 2% GDP
Success Stories & Best Practices
Tamil Nadu Model
Self-Help Group Initiative:
- 5,000 women trained
- ₹25,000/month incomes
- 200+ tonnes annual production
Gujarat’s Industrial Approach
Alginate Export Hub:
- 5 processing units
- ₹300 crore turnover
- 20% annual growth
Lakshadweep Organic Branding
Premium Product Development:
- 100% chemical-free
- EU organic certification
- 3x value realization
Cutting-Edge Innovations
Ocean Afforestation Technology
- Deepwater cultivation systems (25-100m depth)
- Automated harvesting drones
- AI-based growth monitoring
Value Chain Breakthroughs
- Seaweed-based bioplastics (replacing 10% petroplastics)
- Therapeutic extracts (anticancer drug development)
- 3D-printed seafood from algal proteins
Actionable Recommendations
For Government
- Establish National Seaweed Development Board
- Implement Quality Assurance Labs in all coastal states
- Launch “Seaweed in Mid-Day Meals” program
For Entrepreneurs
- Develop ready-to-eat seaweed snacks
- Create seaweed tourism circuits
- Build vertical integration models
For Researchers
- Species domestication programs
- Disease-resistant strain development
- Carbon sequestration measurement protocols