
UNEMPLOYMENT
ILO Definition of Employment
The International Labour Organization (ILO) defines “employment” under its labor force framework in a broad, inclusive, and internationally standardized way. This helps countries uniformly measure and compare labor statistics.
1. Age Limit: Person Aged 15 or Above
Rationale:
- This threshold ensures child labor is excluded. Most international labor standards—including ILO conventions—set 15 as the minimum legal age for employment (with some exceptions).
India’s Context:
- In India, the Child Labour (Prohibition and Regulation) Act also prohibits employment of children below 14 in most occupations.
2. At Least One Hour of Paid Work in the Reference Week
Key Idea:
- If a person does at least one hour of paid or profit-generating work during the reference period (typically one week), they are considered “employed”.
Why One Hour?
To capture all forms of labor participation:
- Part-time workers
- Casual laborers
- Gig economy workers
- Street vendors
- Agricultural day laborers
Implication:
- Even underemployment or marginal employment counts. Someone working 1 hour a week is treated the same as someone working 60 hours.
Criticism:
- Critics argue this may overestimate employment and understate unemployment or underemployment—particularly in developing economies.
3. Absent from Work (for Valid Reasons) Still Counts as Employed
A person is still considered employed even if not working during the reference week, provided the reason for absence is temporary and legitimate, such as:
- Sick leave
- Maternity/Paternity leave
- Paid holidays
- Strikes or lockouts
- Weather-related breaks (in agriculture, for example)
ILO Assumption: These workers have a “job attachment” and are expected to resume work.
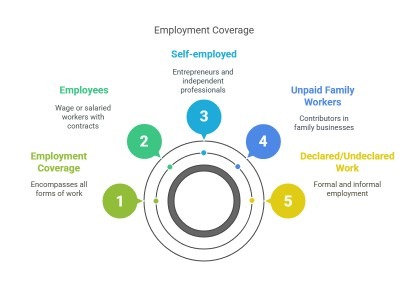
4.Covers All Forms of Employment
A. Employees (Wage or Salaried Workers)
- Working in the public or private sector
- Includes formal jobs with contracts and benefits
B. Self-employed
- Entrepreneurs, shopkeepers, artisans
- Includes small vendors and independent professionals
C. Unpaid Family Workers
- Particularly relevant in agriculture and family businesses, where women and children often contribute without pay
D. Declared or Undeclared Work
- Includes formal (registered, with taxes and benefits) and informal (unregistered, no security) jobs
- Informal work is very high in developing countries (India: 90%+ of workforce).
Why Does the ILO Use This Definition?
Standardization
- Enables global comparison of employment data
- Part of the international labor force framework adopted by most countries
Inclusivity
- Captures the real diversity of work, especially in developing countries where informal and marginal jobs dominate
Policy Utility
Helps in designing:
- Employment programs
- Poverty alleviation
- Social protection systems
Comparison with Indian Estimation Systems
Feature | ILO Definition | Indian System (e.g., NSSO/PLFS) |
Age cutoff | 15+ | Varies: PLFS uses 15+ and also 5+ for some indicators |
Reference period | 1 week | Multiple: Usual status (1 year), Current weekly, Current daily |
Hours worked | ≥ 1 hour | Often uses more detailed thresholds (e.g., 1–14 hrs = marginal, etc.) |
Types of employment | All (including informal) | All, but often segregates by sector/formality |
Temporarily absent workers | Counted as employed | Counted similarly in PLFS |
Causes of Unemployment in India
Unemployment in India is a structural and multi-dimensional problem, driven by a mix of economic, demographic, educational, and institutional factors.
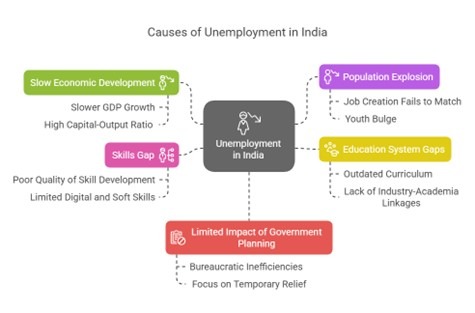
1. Slow Economic Development
What it Means:
- Economic growth in some sectors (especially those that are labor-intensive) has not been rapid enough to create sufficient employment opportunities.
How It Affects Jobs:
- Slower GDP growth → fewer investments → fewer enterprises → fewer jobs.
- High capital-output ratio in some industries means less employment per unit of investment.
Example:
- Despite services sector growth, manufacturing and agriculture have not absorbed labor at the needed scale.
2. Population Explosion
What it Means:
- India adds millions to its labor force each year, creating a massive supply-side pressure on the job market.
Impact:
- Job creation fails to match population growth.
- Youth bulge → high number of educated but unemployed individuals.
- Leads to disguised unemployment in agriculture and informal sectors.
Data Point:
- India’s working-age population is rising rapidly—around 12 million people enter the labor force annually.
3. Education System Gaps
What it Means:
- The Indian education system often emphasizes rote learning over practical skills, failing to prepare students for real-world employment.
Issues:
- Curriculum outdated
- Lack of industry-academia linkages
- Inadequate focus on vocational/technical training
Result:
- Graduates with degrees but no employable skills → educated unemployment
4. Skills Gap
What it Means:
- Even when jobs exist, candidates may not have the right skills demanded by the modern economy.
Reasons:
- Poor quality of skill development programs
- Lack of hands-on training
- Limited digital and soft skills
Example:
- A 2023 NASSCOM report noted that more than 45% of Indian graduates are unemployable in modern tech roles.
5. Limited Impact of Government Planning
Issue:
- While India has had Five-Year Plans, employment programs (like MGNREGA, PMKVY), the implementation and scalability have often fallen short.
Reasons:
- Bureaucratic inefficiencies
- Fragmented approach across ministries
- Focus on temporary relief rather than structural job creation
Outcome:
- The gap between policy and outcomes remains wide, especially in rural and informal sectors.
VARIOUS UNEMPLOYMENT CONCEPTS
1. Labour Supply
Labor supply refers to the total amount of work that workers are willing and able to offer for employment at various wage rates. It is a measure of the availability of labor in the market and often reflects how many hours or days workers are prepared to work given different compensation levels.
Key Features of Labor Supply
1. Measurement:
- Labor supply is measured in terms of man-days or person-days rather than simply counting the number of individuals. This approach allows for a more nuanced understanding of the amount of labor that is available, taking into account the number of hours or days that people are willing to work. For example:
- If a worker is available to work 5 days for a certain wage, this contributes 5 man-days to the labor supply.
- Labor supply is measured in terms of man-days or person-days rather than simply counting the number of individuals. This approach allows for a more nuanced understanding of the amount of labor that is available, taking into account the number of hours or days that people are willing to work. For example:
2. Wage Sensitivity:
- Labor supply is intrinsically linked to wage levels. It is generally considered wage-sensitive, meaning that changes in wage rates can influence one’s willingness to work. For instance:
- As wages increase, individuals may be more inclined to offer more work hours or days, perceiving a higher return on their time. Conversely, if wages decrease, workers may choose to work fewer hours or days since the incentive to work diminishes.
- Labor supply is intrinsically linked to wage levels. It is generally considered wage-sensitive, meaning that changes in wage rates can influence one’s willingness to work. For instance:
3. Availability and Willingness:
- Labor supply reflects not only the number of individuals available for work but also their willingness to engage in employment. Factors that can influence willingness include:
- Personal circumstances (like childcare responsibilities).
- Job satisfaction and preference.
- Economic conditions and alternative employment opportunities.
- Labor supply reflects not only the number of individuals available for work but also their willingness to engage in employment. Factors that can influence willingness include:
Example of Labor Supply
To illustrate labor supply dynamics, consider the following example:
- A worker is willing to work 6 days a week at a wage of ₹500 per day. This translates to a total labor supply of: [ 6 {days} ₹500/ {day} = ₹3000 \ {per week}]
- However, if the wage falls to ₹300 per day, the worker may only be willing to work 3 days a week. In this scenario, their labor supply changes: [ 3 \{days} \times ₹300\{day} = ₹900 \ {per week}]
This example clearly shows that the wage rate impacts the number of days the worker is willing to supply labor. At a higher wage, the individual is more inclined to work more days, reflecting a higher labor supply. At a lower wage, the willingness decreases, illustrating the sensitivity of labor supply to wage changes.
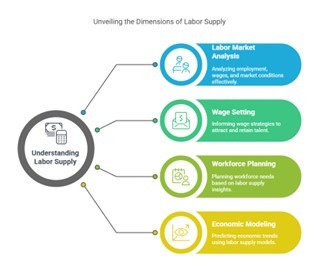
Importance of Understanding Labor Supply
1. Labor Market Analysis:
- Understanding labor supply dynamics helps economists and policymakers analyze employment levels, wage trends, and labor market conditions. Insight into labor supply is crucial for developing effective policies to address unemployment and labor shortages.
2. Wage Setting:
- Businesses can use insights from labor supply analysis to inform their wage-setting strategies. By understanding how supply responds to wage changes, employers can adjust compensation packages to attract and retain talent.
3. Workforce Planning:
- Knowledge of labor supply helps organizations plan workforce needs effectively. Companies can anticipate periods of high demand for labor and adjust hiring practices or training programs accordingly.
4. Economic Modeling:
- Labor supply forms a critical part of economic models that predict workforce trends and overall economic performance. Understanding how labor supply reacts to different factors helps to inform broader economic assessments and forecasts.
2. Labour Force
Definition:
The labor force refers to the total number of individuals who are actively engaged in work or are willing to work. This encompasses both those who are currently employed as well as those who are unemployed but actively seeking work.
Key Characteristics of the Labor Force
1. Active Engagement:
- The labor force includes individuals who are engaged in employment (i.e., working) as well as those who are not working but are available and actively looking for work. This dual inclusion highlights the dynamic nature of the workforce.
2. Not Contingent on Wage Rate:
- Unlike labor supply, which can fluctuate based on wage rates and economic incentives, the labor force is a more stable measure. It represents a count of individuals regardless of current wage levels, focusing instead on their activity level and willingness to work.
3. Measurement:
- The size of the labor force is typically measured in terms of the number of persons within a defined age range (such as 15 years and older) rather than counting man-days or person-days. This approach allows for a clearer understanding of how many individuals are participating in the labor market rather than quantifying the total hours worked.
Significance of the Labor Force
1. Economic Health Indicator:
- The size and composition of the labor force serve as critical indicators of economic health. Changes in the labor force can signal shifts in employment rates, economic activity, and productivity levels.
2. Policy and Planning:
- Understanding the labor force aids policymakers in analyzing labor market trends and developing strategies to address unemployment, workforce training, and education. This information is essential for creating effective labor policies and economic plans.
3. Workforce Development:
- By studying the labor force, governments and organizations can better understand the skills available within the population and identify gaps. This knowledge informs workforce development initiatives, education programs, and employment services tailored to meet market needs.
4. Social Dynamics:
- Analyzing changes in the labor force can provide insights into social dynamics, including gender participation, age demographics, and the effects of immigration or migration trends. This understanding can guide efforts to promote inclusion and diversity in the workplace.
5. Business Strategy:
- Companies leverage labor force data to inform their hiring strategies, workforce management, and market expansion plans. Understanding the available labor supply helps businesses make informed decisions about where to locate operations and how to allocate resources.
3. Workforce
The workforce, also known as the employed population, encompasses all individuals who are currently engaged in economic activity. This includes individuals who are working, regardless of whether they are receiving payment, whether they operate in formal or informal sectors.
Key Features of the Workforce
1. Exclusion of the Unemployed:
- The workforce excludes individuals who are unemployed, even if they are actively seeking work. Therefore, if someone is looking for a job but does not currently hold any employment, they are considered part of the labor force but not part of the workforce.
2. Exclusion of Certain Activities:
- Activities such as begging, stealing, or gambling are not recognized as legitimate economic activities within the context of labor statistics. As a result, individuals engaged in such activities are excluded from the workforce count.
3. Measurement:
- The workforce is quantified in terms of the number of persons actively engaged in employment. This makes it a straightforward metric for analyzing the number of workers contributing to economic productivity.
Workforce vs. Labor Force
Understanding the distinction between the workforce and the labor force is essential for analyzing labor market dynamics:
Workforce:
- Comprises individuals who are currently employed in economic activities. This includes both paid and unpaid work (e.g., family businesses, informal sectors).
- It is a measure of actual employment and does not include individuals who are not working, regardless of their desire or efforts to find work.
Labor Force:
- Encompasses both the employed and the unemployed individuals who are actively seeking employment. It includes those with jobs and those who are currently looking for work.
- The labor force reflects the potential work availability in the market.
Example to Illustrate the Difference:
Workforce:
- A farmer, a shop worker, or an IT professional is considered part of the workforce because they are actively engaged in productive economic activities.
Labor Force:
- A job seeker preparing for examinations is part of the labor force because they are actively looking for work but are not part of the workforce, as they are not currently engaged in any economic activity.
Importance of Understanding the Workforce
1. Economic Analysis:
- The size and composition of the workforce are vital for analyzing economic productivity and performance. A larger workforce often indicates a higher capacity for production and services in an economy.
2. Policy Development:
- Insights into workforce dynamics help policymakers design and implement labor market policies, such as job training programs, minimum wage laws, and employment incentives. This understanding aids in addressing unemployment and ensuring adequate staffing in various sectors.
3. Business Strategy:
- Businesses rely on workforce data to assess labor availability for recruitment and to adapt strategies for operational efficiencies. Understanding the workforce composition is vital for human resource planning and development.
4. Social Insights:
- Analyzing who composes the workforce can reveal important social insights, such as demographic trends, gender representation, and educational attainment among workers. This data is crucial for promoting equality and diversity in the workplace.
Comparative Table
Concept | Includes | Excludes | Unit of Measurement | Wage Dependent |
Labour Supply | All potential work offered at various wages | Not based on headcount | Man-days or person-days | ✅ Yes |
Labour Force | Employed + Unemployed willing to work | Not seeking work | Number of persons | ❌ No |
Workforce | Employed persons only | Unemployed and non-workers | Number of persons | ❌ No |
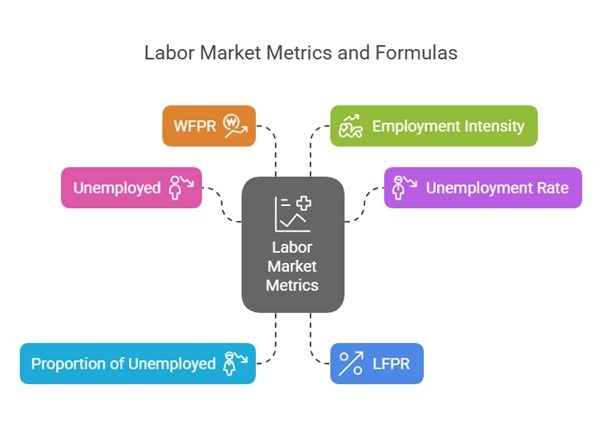
UNEMPLOYMENT METRICS
1. Number of Unemployed Individuals
Definition:
The number of unemployed individuals is defined as the total count of people within the labor force who are currently not employed but are actively seeking employment. This measure is important for evaluating the efficiency of the labor market and understanding economic conditions.
Formula:
Unemployed=Labour Force−Workforce
Example:
If Labour Force = 50 crore, Workforce = 45 crore →Unemployed = 50 – 45 = 5 crore
Significance of Understanding Unemployment Numbers
1. Economic Health Indicator:
- The number of unemployed individuals is a crucial indicator of the labor market’s health. High unemployment levels often signify economic distress, while lower unemployment rates can indicate a robust economy.
2. Policy Development:
- Understanding the number of unemployed people helps governments and policymakers create effective labor market programs and interventions. Resources can be allocated to job training and employment services to reduce unemployment.
3. Social Implications:
- Unemployment can lead to social issues, including poverty, increased dependence on social welfare programs, and mental health challenges for those affected. Monitoring these numbers is essential for addressing societal needs.
4. Labor Market Analysis:
- Researchers and economists analyze unemployment figures to evaluate labor market trends and disparities. This analysis supports better understanding of the effectiveness of various labor policies and economic conditions over time.
5. Business Strategy:
- Employers may use unemployment figures to inform their hiring practices, adjusting recruitment strategies based on available labor supply and market competition.
2. Unemployment Rate (UR)
Definition:
The unemployment rate (UR) is the proportion of unemployed individuals within the labor force, expressed as a percentage. It serves as a key indicator of labor market health, reflecting the ability of an economy to generate job opportunities relative to the number of people actively seeking work.
Formula:
Unemployment Rate = (Number of Unemployed Individuals / Total Labor Force) x 100
Example:
Unemployed = 5 crore, Labour Force = 50 crore UR = (5 / 50) × 100 = 10%
Significance of the Unemployment Rate
1. Indicator of Economic Health:
- The unemployment rate is a critical measure of economic performance. A higher unemployment rate typically signals economic difficulties, while a lower rate suggests a healthier economy with more job opportunities.
2. Policy Implications:
- Policymakers use the unemployment rate to guide decisions on labor market policies and economic interventions. A rising unemployment rate may prompt the government to implement programs designed to stimulate job creation and training.
3. Labor Market Trends:
- Monitoring changes in the unemployment rate over time provides insights into labor market trends, allowing economists to analyze the effects of economic policies, market demand, and external factors such as technological changes or economic crises.
4. Social Impact:
- High unemployment rates can lead to social issues, including increased poverty, crime, and mental health challenges. Understanding unemployment rates helps in assessing these broader social implications.
5. Investment Decisions:
- Investors and businesses often use the unemployment rate as an indicator of economic stability. A declining unemployment rate can signal favorable conditions for investment and expansion, whereas a rising rate may lead to caution in the market.
3. Proportion of Unemployed in Total Population
Definition:
The proportion of unemployed individuals in the total population is a metric that expresses the number of unemployed people as a percentage of the entire population. This measure goes beyond the labor force and provides insight into the broader demographic landscape regarding unemployment.
Formula:
Proportion of Unemployed = (Number of Unemployed / Total Population) * 100.
Importance and Use of the Proportion of Unemployed
1. Broader Demographic Insight:
- This measure provides a more comprehensive understanding of unemployment’s impact on society by including all individuals, not just those in the labor force. It captures the full scale of unemployment relative to the total population, which can highlight the social implications of economic policies.
2. Social Sector Policy Assessments:
- Policymakers and researchers utilize this measure to assess social conditions and the effectiveness of various social programs aimed at addressing unemployment. It helps in identifying trends that may require interventions and support.
3. Evaluating Economic Impact:
- By examining the proportion of unemployed to the total population, analysts can evaluate how widespread unemployment is across different segments of society and how it correlates with economic conditions.
4. Disparity Analysis:
- This metric can reveal disparities in unemployment across different demographics, such as age, gender, and geographic regions. Understanding these disparities can inform targeted interventions to support the most affected groups.
4. Labour Force Participation Rate (LFPR)
Definition:
The Labor Force Participation Rate (LFPR) is the percentage of the population that is actively engaged in the labor market, either by working or actively seeking work. This metric provides insight into the extent of workforce engagement within a specified age group, typically those aged 15 and older.
Formula:
LFPR= (Labor Force / Working-Age Population) * 100.
Example:
Labour Force = 50 crore, Population = 100 crore → LFPR = (50 / 100) × 100 = 50%
- India’s LFPR (2023-24): Around 50% overall, but much lower for women (~25%).
Importance of LFPR
1. Economic Performance Indicator:
- LFPR serves as a key indicator of economic health. A higher LFPR typically signifies a more engaged population able to contribute to economic productivity.
2. Demographic Analysis:
- LFPR provides insights into demographic participation in the labor force, such as how different age groups, genders, and regions engage in economic activities. This information can highlight disparities that may exist.
3. Policy Development:
- Policymakers can utilize LFPR data to create targeted programs designed to increase workforce participation, especially among underrepresented groups like women and youth. Understanding participation rates is essential for developing strategies to support job growth and economic inclusion.
4. Workforce Trends:
- Monitoring changes in the LFPR over time allows analysts to identify trends in labor market engagement, which can provide forecasts about economic conditions and necessary labor market interventions.
5. Social Implications:
- A low LFPR may indicate underlying issues such as discouraged workers who have stopped looking for employment, socioeconomic barriers preventing individuals from entering the labor market, or cultural factors affecting participation, particularly among women.
Notable Statistics
- India’s LFPR (2023-24): As of the 2023-24 statistics, India’s overall LFPR is around 50%. However, there is a significant gender gap, with the LFPR for women estimated to be approximately 25%. This disparity reflects various social, economic, and cultural challenges that may limit women’s participation in the workforce.
5. Workforce Participation Rate (WFPR)
Definition:
The Workforce Participation Rate (WFPR) is the proportion of the total population that is actually employed. This metric helps indicate the extent to which individuals within a population are participating in the workforce and contributing to economic activities.
Formula:
WFPR= (Labor Force / Working-Age Population) * 100
Example:
Workforce = 45 crore, Population = 100 crore →WFPR = (45 / 100) × 100 = 45%
Use:
Measures actual employment coverage in the population.
Importance of WFPR
1. Measure of Employment Coverage:
- WFPR provides a clear representation of the actual coverage of employment within the total population. A higher WFPR indicates that a larger portion of the population is engaged in productive work, reflecting positively on economic conditions.
2. Analysis of Labor Market Performance:
- Tracking changes in WFPR over time helps analysts evaluate the performance of the labor market. Declines in WFPR may highlight issues such as discouraged workers leaving the labor force or difficulties in job creation.
3. Policy Development:
- Understanding WFPR allows policymakers to identify segments of the population that are underrepresented in the workforce. This insight can inform targeted initiatives designed to encourage employment among these populations, such as job training programs or employment incentives.
4. Social Implications:
- By analyzing WFPR, stakeholders can gain insights into social issues, such as gender disparities or challenges faced by certain demographic groups. For example, if WFPR is significantly lower for women or marginalized communities, it may suggest the need for targeted policies to improve their labor market participation.
5. Economic Growth Indicators:
- An increase in WFPR is often associated with economic growth as more individuals are employed and contributing to economic activities. Conversely, a decline may indicate economic slowdown or structural issues in the labor market.
6. Employment Intensity of Growth
Definition:
Employment intensity of growth measures the number of jobs created per unit of economic output, typically quantified in relation to Gross Domestic Product (GDP). This metric provides insights into the relationship between economic growth and employment generation, helping to distinguish between job-rich growth and jobless growth.
Formula:
Employment Intensity=Employed PersonsReal GDP (in lakh ₹)
Use:
Helps assess whether GDP growth is job-rich or jobless. A declining employment intensity suggests jobless growth.
Example:
If 500 lakh people are employed and Real GDP = ₹100 lakh crore:
Employment Intensity = 500 / 100 = 5 workers per lakh ₹ GDP
Importance of Employment Intensity
1. Assessment of Economic Growth:
- Employment intensity helps determine the effectiveness of economic growth in terms of job creation. A higher employment intensity indicates that economic growth is associated with substantial job generation.
2. Identification of Jobless Growth:
- If GDP grows without a corresponding increase in employment, it indicates jobless growth. This scenario may occur due to factors such as automation, technological advancements, or shifts in industry practices that increase productivity without requiring additional labor.
3. Policy Implications:
- Understanding employment intensity allows policymakers to evaluate labor market performance and the impact of economic policies on employment. If employment intensity is declining, it may prompt governments to introduce initiatives aimed at fostering job creation alongside economic growth.
4. Economic Planning and Forecasting:
- Estimating future employment intensity can aid businesses and governments in planning for labor needs as the economy evolves. A clear understanding of how effectively the economy generates jobs relative to growth can improve workforce management and resource allocation.
Summary Table
Metric | Measures | Formula | Unit |
Unemployed | Job seekers not working | LF – WF | Number of persons |
Unemployment Rate | % of LF that is jobless | (Unemployed / LF) × 100 | % |
Proportion of Unemployed | Unemployed as % of total population | (Unemployed / Population) × 100 | % |
LFPR | % of population in labor market | (LF / Population) × 100 | % |
WFPR | % of population actually working | (WF / Population) × 100 | % |
Employment Intensity | Jobs per unit GDP | Employed / Real GDP | Workers per lakh ₹ GDP |
METHODS TO MEASURE UNEMPLOYMENT IN INDIA
(as used by NSO/NSSO, based on M.L. Dantwala Committee (1960) recommendations)
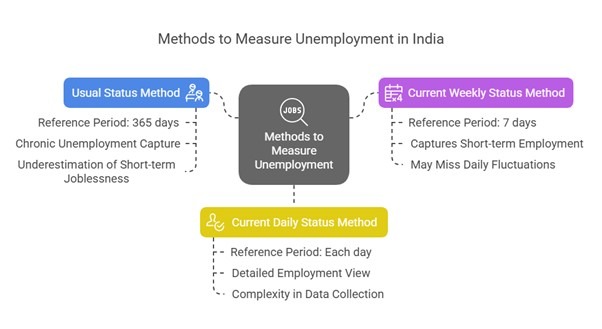
Since 1972-73, three main approaches have been adopted:
1. Usual Status (US) Method – Long-term Perspective
- Reference Period: 365 days (1 year) prior to the survey.
- Definition of Unemployment: A person is classified as unemployed if they did not work and were actively seeking or available for work for a significant portion of the year.
Sub-types
1. Usual Principal Status (PS):
- Focuses on the main activity of the individual based on where they spent the majority of their time over the past year.
2. Usual Principal + Subsidiary Status (UPSS):
- Expands the definition to include any economic activity for at least 30 days alongside the principal activity.
Advantages
- Chronic/Long-term Unemployment Capture: This method effectively identifies individuals who are persistently unemployed over an extended period.
- Inclusion of Subsidiary Employment: It accounts for part-time or seasonal workers who have at least some employment during the year.
Disadvantages
- Underestimation of Unemployment: The US method may overlook individuals who experience short-term unemployment and those who are jobless for a very brief period, particularly seasonal joblessness.
Target Group
- This method primarily captures:
- People who are persistently unemployed.
- Seasonal workers who have worked at least some days during the year, thus providing a broader understanding of employment patterns.
- This method primarily captures:
Unemployment Estimate
- According to this method, the unemployment estimate is considered to be the lowest among the various methods available.
2. Current Weekly Status (CWS) Method – Medium-term View
- Reference Period: 7 days (1 week) prior to the survey.
- Definition of Employment: A person is classified as employed if they worked for at least 1 hour on at least one day during the last week.
Advantages
- Captures Short-term Employment Status: This method effectively identifies those who are employed even if only for a brief period, reflecting immediate labor market conditions.
- More Dynamic than Usual Status: It allows for a quicker response to fluctuations in the labor market, capturing changes in employment status more readily than long-term methods.
Disadvantages
- May Miss Daily/Seasonal Fluctuations: While it captures short-term employment, it may still overlook more frequent, transient changes in employment, particularly those that are seasonal.
- Does Not Fully Reflect Underemployment: The method does not account for individuals who may be working but are not fully utilized (i.e., those who are underemployed or working fewer hours than desired).
Unemployment Estimate
- The unemployment estimate derived from this method is generally higher than that of the Usual Status method but lower than that of the Current Daily Status (CDS) method, indicating a middle-ground perspective on employment levels.
3. Current Daily Status (CDS) Method – Most Inclusive
- Reference Period: Each day during the 7 days prior to the survey.
- Definitions:
- Fully Employed: Individuals who worked 4 or more hours in a day.
- Half-day Employed: Individuals who worked between 1 to 4 hours in a day.
- Unemployed: Individuals who worked less than 1 hour in a day.
Advantages
- Most Detailed: This method captures a comprehensive view of employment by identifying both open unemployment and underemployment, providing a nuanced perspective on labor market dynamics.
- Accounts for Seasonality and Daily Variations: It effectively reflects daily fluctuations in employment, making it sensitive to seasonal shifts and short-term changes.
- Informative for Policy Decisions: The detailed data collected can be particularly useful for policymakers targeting vulnerable and informal sector workers who may experience variable working hours.
Disadvantages
- Complexity in Data Collection and Analysis: The requirement to gather detailed daily data can complicate the collection process, potentially increasing the burden on both respondents and researchers.
Unemployment Estimate
- The unemployment estimate derived from the CDS method is the highest among all the methods, reflecting a broader scope of unemployment that includes various forms of underemployment alongside traditional unemployment.
Comparison Table
Feature | Usual Status (US) | Current Weekly Status (CWS) | Current Daily Status (CDS) |
Reference Period | 365 days | 7 days | Each of last 7 days |
Minimum Work | Major part of year | ≥1 hour on 1 day/week | ≥1 hour/day (graded) |
Captures | Chronic unemployment | Short-term employment | Open + Underemployment |
Estimate Level | Lowest | Medium | Highest |
Best For | Long-term view | Quick status check | Inclusive policy planning |
Why CDS is Preferred (Best Method)
- Captures true scale of underemployment and irregular work
- Reflects seasonal employment patterns (e.g., agriculture)
- Useful in measuring employment intensity and vulnerability
- Helps policymakers design targeted social security programs
TYPES OF UNEMPLOYMENT IN INDIA
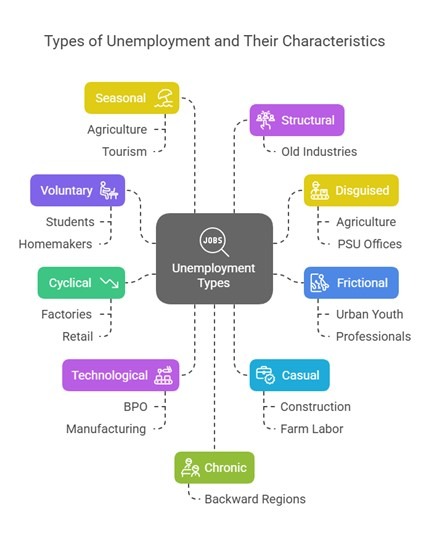
Unemployment is broadly divided into two categories:
1. Voluntary Unemployment
Voluntary unemployment occurs when individuals opt not to engage in work despite the availability of job opportunities. Unlike other types of unemployment driven by economic conditions or skill mismatches, voluntary unemployment stems from personal choices and circumstances. This chapter explores the reasons behind voluntary unemployment and its implications for both individuals and the broader economy.
Conceptual Overview
Voluntary unemployment is characterized by a conscious decision to remain unemployed due to factors such as personal preferences, family obligations, or the pursuit of further education. While this form of unemployment is not inherently negative, it reflects a deliberate choice to prioritize personal goals or responsibilities over immediate employment.
Examples of Voluntary Unemployment
1. Job Market Expectations:
- A recent college graduate may be offered a position with a salary below their expectations. Preferring to wait for a more lucrative opportunity, the graduate chooses not to accept the job, thus experiencing voluntary unemployment.
2. Family Responsibilities:
- An individual may decide to leave or delay entering the workforce to care for a sick family member. Despite available job opportunities, the decision to prioritize caregiving leads to voluntary unemployment.
3. Further Education and Training:
- Choosing to pursue additional education or vocational training can result in a period of voluntary unemployment. The individual invests in future career prospects, which can result in better job opportunities and higher earnings down the line.
Implications and Benefits
Voluntary unemployment can have both positive and negative implications for individuals and society:
Personal and Professional Growth:
- Individuals taking time off to pursue education or training can emerge with enhanced skills, leading to better job opportunities and contributions to economic productivity.
Family and Social Well-being:
- Voluntary unemployment allows individuals to fulfill family responsibilities, contributing to social stability and well-being.
Economic Considerations:
- While voluntary unemployment may reduce immediate labor supply, the long-term economic benefits can be significant if individuals re-enter the workforce with improved qualifications and higher productivity.
Addressing Voluntary Unemployment
Understanding voluntary unemployment enables policymakers and businesses to support individuals in making productive transitions:
Career Guidance and Counseling:
- Providing career advice and resources can help individuals make informed decisions about when to enter or re-enter the workforce and how to align their employment choices with personal goals.
Flexible Work Arrangements:
- Employers offering flexible schedules and remote work options can accommodate personal preferences and family responsibilities, encouraging participation in the labor force.
Support for Education and Training:
- Offering scholarships, grants, and subsidies for education and professional development can facilitate the transition back into the workforce with improved skills and prospects.
2. Involuntary Unemployment
Involuntary unemployment occurs when individuals who are willing and able to work are unable to find employment despite actively searching for job opportunities. This type of unemployment is often a reflection of broader economic conditions and can have significant social and economic impacts. Understanding involuntary unemployment is vital for addressing labor market challenges and fostering economic stability.
Conceptual Overview
Involuntary unemployment is characterized by the inability of individuals to secure jobs even though they possess the skills necessary for available positions and are eager to work. This type of unemployment can arise from various factors, including economic downturns, labor market shifts, and industry-specific challenges.
Causes of Involuntary Unemployment
1. Economic Downturns:
- During recessions or periods of economic decline, businesses may reduce production and cut jobs, leading to increased involuntary unemployment as more individuals seek work with fewer available opportunities.
2. Structural Changes:
- Shifts in the economy, such as technological advancements or the decline of certain industries, can lead to a mismatch between workers’ skills and the available jobs. This structural change can leave skilled workers unemployed.
3. Cyclical Fluctuations:
- Involuntary unemployment is often tied to the business cycle, where economic expansions create jobs, and contractions lead to job losses. Individuals may find themselves suddenly unemployed due to economic fluctuations beyond their control.
Examples of Involuntary Unemployment
1. Recession Scenario:
- During the 2008 financial crisis, many workers across various sectors lost their jobs due to widespread business closures and reduced consumer spending. Individuals wanting to work were left unemployed despite their qualifications and willingness to take available positions.
2. Industry Declines:
- Workers in traditional manufacturing sectors may find themselves involuntarily unemployed as factories close or downsize due to automation or overseas competition. These workers may face challenges when seeking employment in other, more dynamic industries.
Impact of Involuntary Unemployment
The effects of involuntary unemployment extend beyond the individual level, affecting broader economic and social dynamics:
Financial Hardship:
- Unemployed individuals may experience significant financial distress, struggling to meet living expenses, leading to increased reliance on social services and government assistance.
Psychosocial Effects:
- The stress of involuntary unemployment can lead to mental health challenges, decreased self-esteem, and emotional distress, affecting the overall well-being of individuals and families.
Economic Costs:
- High levels of involuntary unemployment can hinder economic growth, decrease consumer spending, and lead to greater fiscal burdens on government resources.
Addressing Involuntary Unemployment
Mitigating involuntary unemployment requires a multifaceted approach that focuses on both immediate relief and long-term structural solutions:
An Economic Stimulus:
- Implementing policies that stimulate job creation, such as government spending on infrastructure projects, can help reduce involuntary unemployment during economic downturns.
Retraining and Upgrading Skills:
- Providing opportunities for workers to acquire new skills and adapt to evolving job markets can help reduce the impact of involuntary unemployment. This can include vocational training programs, apprenticeships, and career counseling.
Job Placement Services:
- Enhancing access to job placement services that connect unemployed individuals with available positions can facilitate better job matching and more efficient re-entry into the labor force.
This is a real concern for the economy and includes multiple sub-types:
3. Disguised Unemployment
Introduction
Disguised unemployment is a critical yet often overlooked concept in economics, where individuals appear to be employed but do not contribute meaningfully to productivity. This phenomenon is particularly prevalent in sectors with labor surpluses and can significantly impact economic efficiency and development.
Conceptual Overview
Disguised unemployment occurs when there are more workers engaged in a labor process than are necessary, leading to labor inefficiency. While these workers are technically employed, their contributions do not enhance productivity or economic output. Understanding this concept is vital for developing policies that can redirect labor resources toward more productive uses.
Illustrative Example
To illustrate disguised unemployment, consider a small agricultural farm that can operate efficiently with four workers. However, due to limited alternative employment options, eight individuals are working on the farm. The additional four workers do not increase the farm’s productivity and are not required for the tasks at hand. This surplus labor illustrates how disguised unemployment can manifest, leading to inefficiencies and the underutilization of potential economic contributions.
Prevalence Across Sectors
Though commonly found in agricultural economies with a lack of job diversity, disguised unemployment can also occur in other sectors like construction and manufacturing. These industries may employ more people than necessary due to similar limitations in job opportunities, resulting in a similar misallocation of human resources.
Measuring Disguised Unemployment
The Marginal Product of Labor (MPL) is a key metric for assessing disguised unemployment. MPL quantifies the additional output generated by adding one more worker to the production process. When MPL is low or zero, any extra labor does not significantly boost output, signifying potential disguised unemployment.
A low or zero MPL indicates that additional labor is not translating to higher productivity, underscoring the need for reallocation or restructuring to enhance economic efficiency.
Implications and Solutions
Recognizing disguised unemployment is crucial for policymakers who aim to optimize labor utilization and productivity. Solutions may include diversifying the economy, improving education and training programs, and creating employment opportunities in more productive sectors. By identifying and addressing the roots of disguised unemployment, economies can better leverage their human resources, fostering sustainable growth and development.
4. Structural Unemployment
Introduction
Structural unemployment is a significant challenge within the labor market, arising from a disconnect between the skills possessed by workers and the demands of available jobs. This type of unemployment reflects broader changes in the economy that render certain skills obsolete while placing increased importance on new competencies. As industries evolve, understanding and addressing structural unemployment becomes crucial for sustaining economic growth and employment.
Conceptual Overview
Structural unemployment occurs when shifts in the economy create a divergence between required job skills and those available in the workforce. Unlike cyclical unemployment, which fluctuates with economic cycles, structural unemployment persists because of changes in technology, consumer preferences, or economic structures. It highlights the need for adaptability and ongoing skill development in the workforce.
Examples of Structural Unemployment
1. Technological Advances:
- The growth of automation and technology has significantly impacted industries such as manufacturing. As machines and robots take over tasks previously performed by humans, workers skilled in traditional manufacturing roles may find themselves unemployed if they cannot transition to roles requiring different skills.
2. Sectorial Shifts:
- Economic transitions, such as the decline of the coal industry and the rise of renewable energy, can leave workers unemployed if they lack the skills necessary for emerging sectors.
3. Educational Gaps:
- In regions with limited access to education and training, workers may find it challenging to acquire skills for in-demand jobs. This is particularly evident in rural or economically disadvantaged areas where educational infrastructure is lacking.
Addressing Structural Unemployment
Combating structural unemployment requires proactive strategies to enhance workforce adaptability:
Education and Training:
- Invest in education and vocational training programs that align with market demands, equipping workers with necessary skills for emerging jobs.
- Implement lifelong learning programs to help workers continuously develop and update their skills.
Government and Industry Collaboration:
- Encourage partnerships between governments and industries to forecast future skill demands and develop relevant training programs.
- Support apprenticeship and re-skilling initiatives that provide practical experience in growing sectors.
Regional Development:
- Focus on regional economic development to create balanced opportunities and reduce geographic disparities in employment and education.
- Establish incentives for businesses to invest and create jobs in economically disadvantaged areas.
5. Seasonal Unemployment
Introduction
Seasonal unemployment is a recurring phenomenon in certain industries, characterized by fluctuations in labor demand throughout the year. This type of unemployment reflects the ebb and flow of economic activity tied to seasonal changes, impacting workers whose livelihoods depend on these cycles. Understanding seasonal unemployment is crucial for developing strategies that provide stability for affected workers and maintain economic vitality.
Conceptual Overview
Seasonal unemployment arises when the demand for workers varies at different times of the year. This variation is often dictated by natural or institutional cycles that affect specific industries. During peak seasons, there’s high demand for labor, but as activity wanes in the off-season, workers may find themselves unemployed.
Examples of Seasonal Unemployment
1. Agricultural Industry:
- The agricultural sector is highly dependent on seasons due to planting and harvesting cycles. Workers are in high demand during these periods to manage crop production. However, in the off-season, the need for labor decreases significantly, leading to potential unemployment for those reliant on agricultural work.
2. Tourism and Hospitality:
- Many tourist destinations experience peak seasons when visitor numbers swell, requiring more workers in hotels, restaurants, and related services. Conversely, during off-seasons, the decline in tourist activity results in reduced demand for labor, and many workers face unemployment until the next peak season.
3. Retail Sector:
- Certain retail sectors, especially those tied to holiday sales, witness higher employment during festive periods. Once the season concludes, temporary workers often lose their jobs as demand normalizes.
Addressing Seasonal Unemployment
Strategies to mitigate seasonal unemployment focus on providing support and enhancing worker adaptability:
Job Training and Re-skilling:
- Implement job training programs that help workers acquire skills useful in other industries during off-seasons, allowing them to transition seamlessly.
- Encourage cross-training in complementary sectors that can offer alternative employment opportunities.
Diversification of Local Economies:
- Encourage the development of industries that are less susceptible to seasonal variations, providing stable employment opportunities year-round.
- Support businesses that offer diverse services or products to balance out peak and off-peak seasons.
Government Interventions:
- Provide unemployment benefits during off-seasons to support workers financially while they seek interim employment or training.
- Implement policies that encourage seasonal industries to offer year-round employment, possibly through tax incentives or subsidies.
6. Technological Unemployment
Introduction
Technological unemployment refers to the displacement of jobs due to advancements in technology, where machines and automation outperform human labor in efficiency and capability. While technological progress drives economic growth and innovation, it also poses challenges to the labor market by reducing the need for certain types of jobs and skills. Understanding this dynamic is crucial for developing strategies that help workers adapt to technological changes.
Conceptual Overview
Technological unemployment occurs when technological advancements lead to the automation of tasks previously performed by human workers. This can result in decreased demand for labor in specific industries, impacting jobs that are susceptible to automation. However, history shows that while some jobs are lost, new opportunities often arise, necessitating a shift in skills and roles.
Examples of Technological Unemployment
1. Automation in Manufacturing:
- Factories increasingly use robots to perform repetitive and precise tasks, which can replace human labor in manufacturing settings. This shift has led to job losses for assembly line workers, necessitating a transition to roles requiring human oversight and maintenance of these technologies.
2. Rise of Self-Driving Vehicles:
- While still in development, self-driving cars have the potential to revolutionize the transportation and logistics sectors. This technology could drastically reduce the need for human drivers, impacting jobs for truck drivers, taxi drivers, and other related occupations.
Historical Context and Modern Implications
Technological unemployment is not new; it has been a part of economic evolution. For instance, the Industrial Revolution displaced many agricultural jobs but created opportunities in manufacturing and services. Similarly, the digital age has opened new avenues in technology-driven fields such as web development and digital marketing.
Concerns today focus on the rapid pace of technological advancement and the potential for broader impacts on employment. The acceleration of automation and artificial intelligence in various industries poses significant challenges, highlighting the need for proactive measures.
Strategies to Address Technological Unemployment
To mitigate the impacts of technological unemployment, a multi-faceted approach is necessary:
Education and Skill Development:
- Enhance education systems to prioritize skills relevant to the digital economy, such as coding, data analysis, and machine learning.
- Promote lifelong learning initiatives to help workers continuously update their skills in response to technological changes.
Policy and Social Safety Nets:
- Develop policies that support job transition programs, providing retraining and career counseling to displaced workers.
- Strengthen social safety nets to provide financial support and security to those affected by job losses during transitions.
Encouraging Innovation and Entrepreneurship:
- Foster environments that encourage innovation and entrepreneurship, creating opportunities for new businesses and industries to emerge.
- Support industries that leverage human creativity and emotional intelligence, areas where humans continue to have an edge over machines.
7. Cyclical Unemployment
Introduction
Cyclical unemployment reflects the fluctuations in employment levels corresponding to the natural rhythm of the economic cycle. During economic downturns or recessions, the demand for goods and services declines, leading businesses to reduce production and lay off workers. This type of unemployment, while typically temporary, can have profound effects on individuals and the economy at large.
Conceptual Overview
Cyclical unemployment arises from the natural ebb and flow of the economic cycle, which consists of periods of expansion and contraction. During contractions, or economic downturns, businesses face reduced demand for their products, prompting cost-cutting measures often involving job reductions. Conversely, as the economy recovers, demand increases, and businesses hire more workers, reducing cyclical unemployment.
Examples of Cyclical Unemployment
1. The Global Financial Crisis of 2008:
- During the 2008 financial crisis, a severe downturn led to widespread layoffs across multiple industries worldwide. As consumer confidence plummeted and spending decreased, companies struggled to maintain operations, resulting in increased unemployment rates.
2. Recessions and Sector-Specific Downturns:
- Economic slowdowns often affect industries differently. For instance, luxury goods and non-essential service sectors may experience higher levels of unemployment during downturns compared to essential goods industries.
Impact and Recovery
Though cyclical unemployment is typically temporary, its impacts can be severe, affecting individuals’ financial stability and overall economic health:
Short-Term Challenges:
- Individuals facing cyclical unemployment may struggle with financial insecurity, difficulties in paying bills, and challenges in securing new employment.
- Communities with high unemployment rates often suffer from reduced economic activity and lower consumer spending, compounding the downturn effects.
Economic Recovery:
- As the economy recovers, cyclical unemployment decreases. An increase in demand spurs businesses to ramp up production and rehiring, facilitating economic growth and improved employment rates.
Addressing Cyclical Unemployment
Policymakers utilize various tools to manage cyclical unemployment during economic downturns:
Fiscal Policy:
- Governments might increase public spending on infrastructure and development projects to create jobs and stimulate demand.
- Tax cuts can boost disposable income and consumer spending, encouraging business investment and job creation.
Monetary Policy:
- Central banks may lower interest rates to make borrowing cheaper, stimulating investment and consumption.
- Quantitative easing and other interventions can inject liquidity into the economy, promoting spending and investment.
8. Frictional Unemployment
Introduction
Frictional unemployment represents a natural and essential component of the labor market dynamics. Characterized by the temporary period of joblessness experienced when individuals are transitioning between jobs or entering the workforce, frictional unemployment plays a vital role in aligning workforce skills with job opportunities, ultimately benefiting the economy by promoting optimal job matching.
Conceptual Overview
Frictional unemployment occurs as individuals shift between jobs, quit positions to seek better opportunities, or enter the job market for the first time. Unlike other forms of unemployment, frictional unemployment is not caused by economic downturns or structural mismatches but by the inherent movement within the job market. This “friction” results from the time-consuming process of job searching and recruitment.
Examples of Frictional Unemployment
1. Career Transitions:
- A software developer resigns to pursue a career as a data analyst. During the period of searching for a suitable data analyst position, the individual is frictionally unemployed, despite possessing relevant skills.
2. Recent Graduates:
- College graduates entering the job market often experience a phase of frictional unemployment as they seek positions that match their education and career goals.
Significance and Benefits
Frictional unemployment is generally temporary and often short-term. It is considered beneficial for several reasons:
Improved Job Matches:
- By allowing workers to search for positions that better match their skills and career aspirations, frictional unemployment facilitates healthier job-market efficiencies and more satisfying employment relationships.
Labor Market Fluidity:
- A dynamic labor market, with workers continuously entering and exiting positions, encourages businesses to innovate and adapt, fostering economic growth.
Skill Utilization:
- Frictional unemployment allows workers to leverage their skills in roles where they can be most productive and fulfilled, enhancing overall labor resource utilization.
Addressing Frictional Unemployment
Strategies to support individuals and reduce the duration of frictional unemployment focus on enhancing job-matching processes:
Career Services and Support:
- Universities and governments can provide career counseling and job placement services to assist individuals in finding suitable positions quickly.
Job Market Information:
- Improving access to comprehensive job market data can help individuals make informed decisions about career changes and job searches, reducing the friction involved in finding new employment.
Networking and Recruitment Events:
- Organizing job fairs and networking events can connect job seekers directly with employers, accelerating the job-matching process.
9. Keynesian Unemployment
Introduction
Keynesian unemployment is a critical concept grounded in Keynesian economics, which emphasizes the role of aggregate demand in determining employment levels within an economy. John Maynard Keynes, a pioneering economist, posited that insufficient aggregate demand can lead to prolonged periods of unemployment. This chapter explores the principles of Keynesian unemployment, its causes, and potential remedies.
Conceptual Overview
At the core of Keynesian economics is the belief that the economy is not always self-correcting and can remain stuck in recession or depression phases without external intervention. Keynes argued that during such times, a decline in aggregate demand leads to insufficient consumer and business spending, resulting in decreased production and, consequently, higher unemployment rates.
Causes of Keynesian Unemployment
1. Insufficient Aggregate Demand:
- When consumers, businesses, and governments collectively reduce their demand for goods and services, it can trigger a chain reaction. Businesses may experience declining sales and revenue, prompting them to cut back on production and lay off workers, leading to unemployment.
2. Economic Downturns:
- Keynesian unemployment typically manifests during recessions or depressions when overall economic activity slows down, and confidence in the market diminishes. When consumer spending drops, businesses struggle to maintain their workforce.
Examples of Keynesian Unemployment
1. Recessionary Periods:
- During economic downturns, such as the 2008 financial crisis, households may reduce spending due to fear of job losses or financial difficulties. As demand for goods and services declines, businesses may be forced to lay off employees, contributing to rising unemployment rates.
2. Persistent Economic Weakness:
- In situations where economic recovery is sluggish, such as in a prolonged recession, businesses remain hesitant to hire new staff due to uncertainty regarding consumer demand. This hesitancy can result in sustained unemployment levels.
Government Intervention Strategies
Keynes believed that government intervention was essential to stimulate aggregate demand and mitigate Keynesian unemployment. Various policies can be implemented to increase demand and promote economic growth:
1. Fiscal Policy:
- Government Spending: By increasing public spending on infrastructure projects, education, and healthcare, the government can generate jobs and stimulate demand. Such spending injects money into the economy and encourages businesses to hire.
- Tax Incentives: Providing tax breaks or incentives to businesses can encourage investment and expansion, leading to increased hiring.
2. Monetary Policy:
- Lowering Interest Rates: By reducing interest rates, central banks can make borrowing cheaper for consumers and businesses. Lower borrowing costs stimulate spending on goods, services, and investments, enhancing aggregate demand and reducing unemployment.
- Quantitative Easing: Central banks may engage in quantitative easing by purchasing government securities to increase money supply and encourage lending, further promoting economic activity.
Summary Table
Type | Key Characteristic | Sector Example |
Voluntary | Choice not to work | Students, homemakers |
Structural | Skill-job mismatch | Old industries |
Disguised | More workers than needed | Agriculture, PSU offices |
Frictional | Temporary, job transitions | Urban youth, professionals |
Cyclical | Caused by recession | Factories, retail |
Chronic | Long-term unemployment | Backward regions |
Technological | Job loss due to machines | BPO, manufacturing |
Casual | Temporary jobs, irregular work | Construction, farm labor |
Seasonal | Work available only part of the year | Agriculture, tourism |
Casualisation and Informalisation of Workforce in India
The concepts of casualisation and informalisation have significant implications for the labor market in India, particularly in terms of job security and economic stability. This overview will define key terms, highlight the current trends in casualisation, and explore the statistics that illustrate these issues.
Distinction Between Casual Workers and Regular Workers
Workers in the labor market can be broadly categorized into those who are self-employed and those who are hired. Among hired workers, there are two primary classifications:
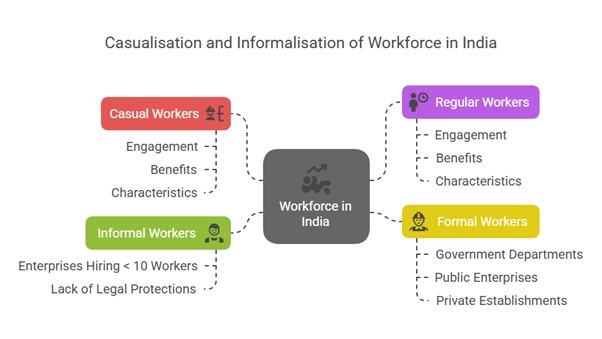
1. Casual Workers:
- Engagement: Casual workers are typically hired on a daily wage basis, often lacking a long-term employment contract.
- Benefits: They do not receive social security benefits such as:
- Provident fund
- Gratuity
- Pension
- Characteristics: Their work is often unstable, and they may not have consistent employment, making them vulnerable to economic fluctuations and crises.
2. Regular Workers:
- Engagement: Regular workers are employed on a permanent payroll basis. They usually have a formal employment contract.
- Benefits: They are entitled to various social security benefits that provide a safety net, such as:
- Provident fund
- Gratuity
- Pension
- Characteristics: Regular workers typically enjoy job stability and protections against arbitrary termination.
Distinguishing Formal Workers from Informal Workers
According to the National Commission for Enterprises in the Unorganised Sector (NCEUS):
Formal Workers:
- Defined as those employed in the organized sector, which includes:
- Government departments
- Public enterprises
- Private establishments that employ 10 or more workers
- Formal workers have legal protections, benefits, and regulated working conditions.
- Defined as those employed in the organized sector, which includes:
Informal Workers:
- Defined as workers employed in the unorganized sector, which typically consists of:
- Enterprises hiring fewer than 10 workers
- Informal workers often lack access to basic benefits, legal protections, and are generally excluded from formal regulations, making them more vulnerable than their formal counterparts.
- Defined as workers employed in the unorganized sector, which typically consists of:
Increasing Casualisation in India
The rise of casualisation in the Indian labor market is a concerning trend that affects millions of workers. Here are some important data points and trends related to casualisation:
1. Current Statistics:
- According to the Centre for Monitoring Indian Economy (CMIE) from their Employment-Unemployment Survey 2022-23 (conducted in June-July):
- Casual workers constituted approximately 29.3% of the total workforce in India, reflecting an increase from:
- 27.5% in 2021-22
- 26.2% in 2020-21
- Casual workers constituted approximately 29.3% of the total workforce in India, reflecting an increase from:
- This rise indicates a growing reliance on casual employment, which often lacks the protections associated with regular work.
- According to the Centre for Monitoring Indian Economy (CMIE) from their Employment-Unemployment Survey 2022-23 (conducted in June-July):
Rural vs. Urban Trends:
- The growth in casual employment is primarily driven by the rural sector, where casual workers now make up 37.1% of the workforce. This high percentage highlights the significant economic activity taking place in informal settings in rural areas, where many depend on casual work for their livelihoods.
Implications of Rising Casualisation:
- Job Security: The increasing prevalence of casual workers raises concerns about job security and the precarious nature of employment. Casual workers are frequently subject to sudden job loss without notice or severance pay.
- Economic Stability: Casualisation can lead to increased financial instability for families, as earnings may fluctuate and are often lower than in regular employment.
- Social Protections: The lack of social security benefits for casual workers poses significant challenges, particularly in times of economic distress or personal emergencies.
Key Findings from Reports and Studies
1. International Labour Organization (ILO):
World Employment and Social Outlook – Trends 2023:
- The ILO estimates that India’s informal employment rate, which includes casual work, is projected to remain high at around 84% in 2023. This figure underscores the pervasive nature of informal employment in India, which encompasses a broad array of labor arrangements with limited protections.
- The report emphasizes the vulnerability of informal workers, noting that they often lack access to social protection and experience precarious working conditions, making them susceptible to economic shocks.
2. Periodic Labour Force Surveys (PLFS):
PLFS Data from 2019-20:
- The data reveals that casual workers make up 56.9% of the non-agricultural workforce in India. This rising figure indicates a persistent trend of casualisation across various industries, highlighting an increasing reliance on non-permanent employment arrangements.
Reports by Think Tanks and Research Institutions:
- Azim Premji University (2022 report “India’s Employment Crisis: Evidence from Household Surveys”):
- This report points to the increasing precariousness of work in India with casualisation identified as a major contributing factor to labor market instability.
- Centre for Sustainable Employment (2021 report “The Gig Economy in India: A Preliminary Assessment”):
- This report discusses the emergence of gig work, often categorized as casual employment, highlighting issues related to worker exploitation and the lack of social security protections.
- Azim Premji University (2022 report “India’s Employment Crisis: Evidence from Household Surveys”):
Factors Contributing to Casualisation
1. Rural-Urban Migration:
- Many disguised unemployed rural workers migrate to urban areas in search of non-farm employment. Due to insufficient skills and training, they frequently end up as casual workers in urban settings, which often demand immediate labor without formal contracts.
2. Real Estate Boom and MGNREGS:
- The rapid expansion of the real estate sector in urban areas has created numerous job opportunities, particularly in construction. Concurrently, the Mahatma Gandhi National Rural Employment Guarantee Scheme (MGNREGS) has enhanced employment opportunities in rural areas, leading to increased casual work as daily-rated laborers are required in both sectors.
3. Impact of Informalization:
- The growing trend of informalization in the economy further exacerbates casualisation. Workers in informal settings frequently lack job security and access to benefits, contributing to a more vulnerable workforce.
Potential Solutions to Address Casualisation
1. Educational Reforms:
- Implementing educational reforms that focus on skill development is crucial. Enhancing access to quality education and vocational training can equip workers with the necessary qualifications to secure more formal employment.
2. Government Initiatives for Skill Development:
- The government should invest in programs aimed at improving skill set alignment with market demands. Initiatives could include training programs tailored to high-demand sectors, promoting higher employability among casual workers.
3. Encouraging Self-Employment:
- Facilitating easy access to credit for entrepreneurs can stimulate self-employment opportunities. Supporting micro and small enterprises through financial aid and providing necessary infrastructure can help create stable jobs.
4. Strengthening Labour Laws:
- To protect casual workers, it’s essential to strengthen labor laws that provide safeguards against exploitation and ensure a minimum standard of working conditions across all sectors.
5. Promoting Social Security Programs:
- The government could develop social security frameworks that extend protections to informal and casual workers, including provisions for health care, retirement benefits, and unemployment insurance.
Increasing Informalisation in India
The trend of increasing informalisation in the Indian labor market represents a critical issue affecting millions of workers. According to the CMIE’s Employment-Unemployment Survey 2022-23, approximately 84.9% of the workforce is engaged in the informal sector, a figure that indicates a troubling stability in its high level over the years. Understanding the factors contributing to this situation is essential for developing effective policies.
Factors Contributing to the Increase in Informalisation
1. Transition to a Market Economy:
- The shift from a controlled economy to a market economy following the liberalization, privatization, and globalization (LPG) reforms of the early 1990s has significantly influenced the structure of the workforce. As the economy opened up, there was a correlation between increased market dynamics and the informalisation of employment. This has resulted in fewer protections for workers and a rise in precarious employment conditions.
2. Insufficient Vocational Skills:
- A key factor in the rise of informalisation is the lack of vocational skills among the entry-level labor force. Many individuals entering the job market may not possess the qualifications or technical skills necessary to secure formal jobs. This skills gap drives them to accept informal work, which typically requires less formal education and training.
3. Complex Labor Laws and Regulations:
- The complexity of labor laws and regulatory frameworks in India poses challenges for the growth of private firms in the formal sector. Navigating these regulations can be burdensome, leading many businesses to opt for hiring casual or contractual workers to avoid the compliance costs associated with formal employment. As a result, this reliance on informal labor becomes a convenient solution.
4. Neglect of the Micro, Small, and Medium Enterprises (MSME) Sector:
- Despite their potential, the Micro, Small, and Medium Enterprises (MSME) sector has received insufficient attention and support. These enterprises can play a crucial role in fostering formal employment, but challenges such as limited access to finance, inadequate infrastructure, and lack of targeted policies hinder their growth. Consequently, many MSMEs operate informally, contributing to overall informalisation.
Implications of Increasing Informalisation
- Vulnerability to Economic Shocks: Workers in the informal sector often lack access to benefits such as health care, retirement savings, and unemployment insurance. This makes them exceptionally vulnerable to economic fluctuations and crises, as they have no safety net during downturns.
- Reduced Job Security: Informal workers are frequently employed under precarious conditions that lack job stability. Their positions can be terminated without notice or severance pay, leading to job insecurity and financial instability.
- Limited Access to Resources: Informal workers often miss out on training and skill development opportunities, making it difficult to progress in their careers and access better job prospects.
Proposed Strategies to Address Informalisation
To combat the increasing trend of informalisation, a multi-faceted approach is necessary:
1. Skill Development Programs:
- Implementing comprehensive skill development initiatives aimed at enhancing the vocational skills of the labor force is essential. These programs should be aligned with industry needs to ensure that workers are equipped for formal job opportunities.
2. Simplification of Labor Laws:
- Simplifying labor laws and regulations can encourage businesses to formalize their workforce. Streamlined procedures and reduced compliance costs can incentivize firms to offer formal employment instead of relying on casual or contractual arrangements.
3. Support for MSMEs:
- Providing targeted support for the MSME sector can stimulate formal job creation. Measures could include easier access to credit, infrastructure development, and capacity-building initiatives that empower small enterprises to grow and transition from informal to formal status.
4. Enhanced Social Protection:
- Establishing social security systems that extend protections to informal workers can mitigate their vulnerability. Measures such as health insurance, retirement benefits, and unemployment support will help to create a more stable workforce.
5. Awareness and Advocacy:
- Raising awareness about informal workers’ rights and the benefits of formal employment can encourage workers and employers to pursue formal arrangements. Policy advocacy can help to reshape perceptions of informal work and highlight its challenges.
Periodic Labour Force Survey (PLFS) and All-India Quarterly Establishment-Based Employment Survey (AQEES)
The Periodic Labour Force Survey (PLFS) and the All-India Quarterly Establishment-Based Employment Survey (AQEES) represent significant advancements in the collection and analysis of labor market data in India. This overview covers the key aspects, objectives, and methodologies of these surveys.
Periodic Labour Force Survey (PLFS)
Background
- The National Sample Survey Organisation (NSSO) traditionally conducted the Employment and Unemployment Surveys (EUS) every five years since 1972, serving as the primary source of labor market data in India.
- Recognizing the increasing need for more frequent and reliable labor force data, the National Statistics Office (NSO) under the Ministry of Statistics and Programme Implementation initiated the PLFS. The first annual report based on PLFS data collected from July 2017 to June 2018 was published in May 2019.
Primary Objectives
1. Urban Employment Dynamics:
- To assess the dynamics of labor force participation and employment status within a short three-month interval, specifically for urban areas. This frequent measurement enhances the responsiveness of policymakers.
2. Annual Labor Force Parameters:
- To measure key labor force parameters on an annual basis for both rural and urban areas, including:
- Labor Force Participation Rate (LFPR)
- Worker Population Ratio (WPR)
- This data provides insights into broader employment trends and workforce engagement.
- To measure key labor force parameters on an annual basis for both rural and urban areas, including:
All-India Quarterly Establishment-Based Employment Survey (AQEES)
Background
- Launched by the Labour Bureau under the Ministry of Labour and Employment, the AQEES aims to provide quarterly updates on employment and related variables across the organized and unorganized segments of the economy. It covers nine selected sectors that represent a significant portion of total non-farm employment. These sectors are:
- Manufacturing
- Construction
- Trade
- Transport
- Education
- Health
- Accommodation and Restaurants
- IT/BPO (Information Technology/Business Process Outsourcing)
- Financial Services
- Launched by the Labour Bureau under the Ministry of Labour and Employment, the AQEES aims to provide quarterly updates on employment and related variables across the organized and unorganized segments of the economy. It covers nine selected sectors that represent a significant portion of total non-farm employment. These sectors are:
Components of AQEES
AQEES comprises two primary components:
1. Quarterly Employment Survey (QES):
- This component covers establishments with 10 or more workers and predominantly represents the organized segment of employment. The aim is to gather data that reflects employment trends and conditions in larger establishments.
2. Area Frame Establishment Survey (AFES):
- AFES focuses on establishments with 9 or fewer workers, primarily within the unorganized segment. This component is vital for understanding the informal sector and capturing data that is often missed in traditional surveys.
Key Highlights from QES (April to June 2021)
- Nearly 90% of establishments surveyed operate with fewer than 100 workers, highlighting the predominance of small-scale employment.
- The participation of female workers in the workforce stands at approximately 29%, indicating ongoing challenges related to gender representation in the labor market.
- AFES fieldwork is currently underway, which will further enrich the data available on smaller and unorganized sectors.
Importance of AQEES and PLFS
- Regular Updates: AQEES provides regular updates on employment from the demand side and is instrumental for policy planning. This ongoing data collection complements PLFS’s more broad-based annual household surveys.
- Comprehensive Coverage: While Economic Censuses provide establishment-based data, they are conducted at irregular intervals and do not cover all types of establishments. The 7th Economic Census (2020) results are still pending publication, emphasizing the need for continuous workforce data collection.
- Data-Driven Decision Making: Both PLFS and AQEES facilitate data-driven policymaking by providing timely and relevant information that can be used to create effective employment strategies, enhance labor market policies, and improve social protection measures for workers.
Size of Workforce: Key Indicators from the Ministry of Labour and Employment Report
The “Labour and Employment Statistics 2022” report from the Ministry of Labour and Employment provides vital insights into the size and dynamics of the workforce in India. Here’s a summary of key indicators on labor force participation, employment status, sectoral employment, and unemployment from the report.
Key Indicator 1: Labour Force Participation Rate (LFPR)
LFPR Trends:
- 2017-18: 49.8%
- 2018-19: 50.2%
- 2019-20: 53.5%
- 2020-21: 54.9%
The LFPR for individuals aged 15 years and above has demonstrated a consistent upward trend, indicating an increase in the proportion of the population engaged or seeking to be engaged in the labor market.
Gender Breakdown:
Female LFPR:
- 2017-18: 23.3%
- 2020-21: 32.5%
- This represents a significant increase of 9.2 percentage points, highlighting improvements in female workforce participation.
Male LFPR:
- 2017-18: 75.8%
- 2020-21: 77.0%
- The male LFPR increased by 1.2 percentage points, indicating a more gradual rise compared to female participation.
Key Indicator 2: Status in Employment
Self-Employment:
- The share of workers in Self-Employment (which includes own-account workers and helpers in household enterprises) rose to 55.6% by 2020-21, up from 52.2% in 2017-18. This indicates a growing trend towards self-employment as a means of livelihood.
Female Employment Distribution:
- A larger proportion of female workers were engaged as Helpers in household enterprises (36.6%), followed by Casual Labour (23.2%).
Male Employment Distribution:
- Around 44.8% of male workers were involved as Own-account workers and Employers, while 22.7% held Regular wage/salaried positions during 2020-21.
Key Indicator 3: Employment by Sector
Agriculture:
- The agriculture sector remains the largest employer, absorbing 46.5% of total workers in 2020-21, an increase from 44.1% in 2017-18. This reflects the ongoing reliance on agriculture for employment despite challenges.
Services and Industries:
- The Services sector and Industry sector saw varying trends:
- 2017-18 Services: 31.1%, Industry: 24.8%
- 2018-19 Services: 32.3%, Industry: 25.2%
- In 2020-21, Services declined due to the impacts of the COVID-19 pandemic, while the Industry sector showed a slight increase to 23.9% from 23.7% in 2019-20.
- The Services sector and Industry sector saw varying trends:
Gender Dynamics:
- The proportion of female workers in the agriculture sector increased to 62.2% during 2020-21 from 57.0% in 2017-18.
- Conversely, the percentage of male workers in agriculture decreased slightly from 40.2% in 2017-18 to 39.8% in 2020-21.
- Female contributions in the Services and Industry sectors declined, while male participation increased, indicating changing gender roles within these sectors.
Key Indicator 4: Unemployment Rate (UR)
Unemployment Rate Trends:
- 2017-18: 6.0%
- 2018-19: 5.8%
- 2019-20: 4.8%
- 2020-21: 4.2%
The unemployment rate showed an overall improvement, declining to 4.2% in 2020-21, indicating a recovery from the higher rates in previous years.
Gender Breakdown of Unemployment:
- The female unemployment rate significantly improved, decreasing to 3.5% in 2020-21 from 5.6% in 2017-18, showcasing favorable trends in female employment.
- Male unemployment also decreased to 4.5% in 2020-21 from 6.1% in 2017-18, but not as notably as female rates.
Has MGNREGA Played a Vital Role in Curbing Unemployment, and Should It Be Sustained?
The Mahatma Gandhi National Rural Employment Guarantee Act (MGNREGA) is a significant initiative of the Government of India, aimed at providing guaranteed wage employment for every rural household. Launched in 2006, MGNREGA specifically targets rural unemployment by ensuring a minimum of 100 days of wage employment per year.
Overview of MGNREGA
- Wage Rate: The stipulated wage rate varies across states, with recent rates ranging from ₹717 to ₹2,284 per day, as per notifications issued in March 2019.
- COVID-19 Response: In March 2020, in light of the economic challenges posed by the COVID-19 pandemic, the government increased the wage rate by ₹20 and allocated an additional ₹40,000 crore to support livelihoods and enhance the program’s effectiveness during the crisis.
Achievements of MGNREGA
1. Increased Job Opportunities:
- MGNREGA has successfully provided job opportunities in rural areas, contributing to a reduction in rural unemployment and offering economic stability to households.
2. Enhanced Participation of Marginalized Groups:
- The program has notably increased the involvement of marginalized communities, including Scheduled Castes (SC), Scheduled Tribes (ST), and women, promoting social inclusivity and empowering disadvantaged groups.
3. Improved Financial Inclusion:
- Wage payments are made through bank and post office accounts, which has led to better financial inclusion for rural workers who previously had limited access to banking services.
4. Creation of Durable Rural Assets:
- MGNREGA has facilitated the development of essential rural infrastructure, including ponds, check dams, roads, and plantations, which contribute to long-term community benefits beyond immediate employment.
Criticisms of MGNREGA
Despite its successes, MGNREGA faces several criticisms and implementation challenges:
1. Delayed Wage Payments:
- There have been instances of delayed wage payments to workers, which can undermine the program’s reliability and the financial stability of households depending on timely payments.
2. Decreasing Allocation for Wage Component:
- Some panchayats have reduced the allocation for the wage component in their annual MGNREGA action plans, which can limit the effectiveness of the program in providing guaranteed employment.
3. Reluctance to Disburse Unemployment Allowances:
- Households that have requested employment but have not received work often face difficulties in obtaining the unemployment allowances they are entitled to, which can lead to inequities.
Overall Impact and Recommendations
Despite the highlighted inefficiencies and challenges, MGNREGA has revitalized Panchayati Raj institutions and fostered a culture of entitlement among marginalized populations. This program has been recognized internationally; for instance, the UNDP acknowledged MGNREGA in its 2015 Human Development Report as a landmark employment guarantee scheme.
Recent Government Initiatives to Reduce Unemployment
The Government of India has prioritized employment generation through various schemes and programs aimed at creating job opportunities and enhancing skills among the workforce. Below is a summary of key initiatives and their impact on employment generation:
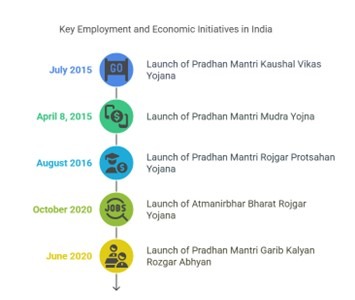
1. Pradhan Mantri Rojgar Protsahan Yojana (PMRPY)
Objective:
The Pradhan Mantri Rojgar Protsahan Yojana (PMRPY) was launched in August 2016 with the primary goal of incentivizing employers to create new employment opportunities in the organized sector. This initiative specifically aims to encourage the hiring of young workers, particularly individuals from historically marginalized demographic groups such as Scheduled Castes (SC), Scheduled Tribes (ST), and women. By alleviating some of the financial burdens on employers, the scheme seeks to stimulate job creation and enhance workforce participation.
Implementation:
Under PMRPY, the government covers a significant portion of the employer’s contribution to the Employee Provident Fund (EPF) for new employees. Specifically, the initiative provides the following benefits:
- Subsidy on EPF Contribution: The scheme covers the employer’s 12% EPF contribution for new employees for the first three years. This subsidy reduces the financial burden on employers, making it more attractive for them to hire additional staff.
- Targeted Support: The program places an emphasis on promoting inclusivity by specifically aiming to support the employment of youth, especially those from SC/ST communities and women. This approach seeks to create diverse and sustainable employment opportunities.
Outcomes:
As of March 31, 2022, PMRPY has achieved significant milestones:
- Beneficiaries: The scheme has positively impacted 1.22 crore employees, providing them with job security and improved livelihoods.
- Establishments: A total of 1.53 lakh establishments have benefitted from this initiative. These establishments, primarily in the organized sector, have taken advantage of the incentives offered to expand their workforce.
- Boost in Employment Generation: By encouraging employers to hire new workers, PMRPY has effectively contributed to employment generation in the organized sector, addressing the challenges of unemployment and underemployment among young people.
2. Atmanirbhar Bharat Rojgar Yojana (ABRY)
Objective:
The Atmanirbhar Bharat Rojgar Yojana (ABRY) was introduced in October 2020 as a response to the economic challenges posed by the COVID-19 pandemic. The primary goal of the scheme is to incentivize the creation of new employment opportunities across various sectors, especially in micro, small, and medium enterprises (MSMEs). By providing financial support to employers, ABRY aims to encourage businesses to ramp up hiring after the significant layoffs and employment disruptions caused by the pandemic.
Implementation:
Under ABRY, the government implemented various measures to incentivize employers:
- Incentives for Hiring: The scheme provided financial incentives to employers for hiring new employees. This was particularly targeted at sectors severely affected by the pandemic, enabling businesses to recover and rebuild their workforce.
- Focus on MSMEs: With a strong emphasis on micro, small, and medium enterprises, ABRY sought to revitalize this crucial segment of the economy, which plays a significant role in employment generation.
- Scheme Duration: The ABRY scheme was initially launched in October 2020 and was in effect until March 2022, during which time it was essential for supporting economic recovery.
Outcomes:
As of June 18, 2022, the Atmanirbhar Bharat Rojgar Yojana has achieved notable results:
- Beneficiaries: Approximately 59.49 lakh employees were positively impacted by the incentives provided under the scheme, allowing them to secure employment opportunities that may have otherwise been unavailable during the recovery period.
- Establishments: A total of 1.49 lakh establishments benefitted from the program, helping them to navigate the challenges imposed by the pandemic and promote workforce expansion.
- Facilitation of Recovery: ABRY played a critical role in facilitating employment generation in a challenging economic context, supporting the overall recovery efforts and providing impetus to both businesses and workers as the economy began to reopen.
3. Pradhan Mantri Kaushal Vikas Yojana (PMKVY)
Objective:
The Pradhan Mantri Kaushal Vikas Yojana (PMKVY) was launched in July 2015 with the primary goal of enhancing the employability of youth in India through industry-relevant skill training and certification. The initiative aims to bridge the skill gap in the country by providing individuals with the skills needed to secure better employment opportunities.
Implementation:
PMKVY is structured to provide a comprehensive approach to skill development through the following mechanisms:
- Skill Certification and Training: The scheme focuses on providing skill training that is aligned with market demands and industry standards. This includes a wide range of sectors and job roles to cater to diverse employment needs.
- Financial Incentives: The program offers financial incentives to:
- Training Providers: Institutes that conduct skill training under PMKVY receive funding to ensure quality training and resources.
- Candidates: Youth participating in the training programs can receive financial support as well, motivating them to complete their courses and pursue skill enhancement.
- Quality Assurance: The scheme emphasizes outcomes, with an emphasis on placements following training. Training providers are assessed based on their ability to successfully place candidates in jobs, thereby ensuring accountability and effectiveness.
Outcomes:
As of March 7, 2022, PMKVY has made significant strides in achieving its objectives:
- Candidates Trained: A total of 1.35 crore candidates have undergone training under the program, representing a substantial scale of engagement in skill development.
- Successful Placements: Out of those trained, approximately 23.96 lakh candidates have successfully secured employment in various job sectors. This outcome highlights the scheme’s effectiveness in enhancing employability and bridging the skills gap in the labor market.
- Contribution to Skill Enhancement: PMKVY has played a pivotal role in equipping the youth with necessary skills, increasing their chances of gaining employment and contributing to the overall economic growth of the country.
4. Pradhan Mantri Garib Kalyan Rozgar Abhiyan (PMGKRA)
Objective:
The Pradhan Mantri Garib Kalyan Rozgar Abhiyan (PMGKRA) was launched in June 2020 as a response to the economic fallout from the COVID-19 pandemic. The primary objective of the scheme was to provide immediate employment opportunities to migrant workers who had returned to rural areas after losing their jobs in urban settings. The initiative aimed to restore their lost livelihoods and support rural employment generation during a critical time.
Implementation:
PMGKRA was structured to deliver results through various key measures:
- Employment Generation: The scheme created increased job opportunities by targeting sectors impacted by the pandemic, focusing on rural infrastructure development. It helped mobilize workers to engage in labor-intensive projects.
- Incentives for Employers and Workers: The program incentivized both employers and workers by providing a framework that enabled wage employment. It featured a focus on providing social security benefits alongside wages, supporting the financial stability of workers.
- Targeted Works: PMGKRA emphasized activities related to rural infrastructure, such as road construction, irrigation facilities, and asset creation, which were essential for sustainable development in rural areas.
Outcomes:
By October 22, 2020, PMGKRA achieved substantial milestones, reflecting its impact on rural employment:
- Employment Generated: The scheme generated an impressive 50.78 crore person-days of employment, indicating extensive workforce engagement in various projects designed to support rural economies.
- Expenditure: The total expenditure incurred for the implementation of the scheme amounted to ₹39,293 crore, reflecting the government’s commitment to bolstering rural employment and infrastructure development.
- Boost to Rural Employment: By providing immediate job opportunities and enhancing infrastructure, PMGKRA made a significant contribution to rural livelihoods during a time of widespread economic uncertainty.
5. Pt. Deen Dayal Upadhyaya-Grameen Kaushalya Yojana (DDU-GKY)
Objective:
The Pt. Deen Dayal Upadhyaya-Grameen Kaushalya Yojana (DDU-GKY) is a skill development initiative launched by the Government of India with the primary goal of reducing poverty among rural households. The scheme aims to enable individuals from economically disadvantaged backgrounds to access both self-employment and wage employment opportunities through comprehensive skill training.
Implementation:
- Focused on Rural Employment: DDU-GKY was specifically designed to address the challenges of rural employment by providing skill training that is both relevant and aligned with market needs. The program prioritizes helping rural youth develop employable skills.
- Placement-Linked Skill Training: A key feature of DDU-GKY is its emphasis on placement-linked training. This means that the training institutes are accountable for not only delivering skill training but also facilitating placements for the trained candidates in suitable jobs.
- Targeted Approach: The program predominantly targets rural youth, ensuring that the skill development initiatives cater to the unique economic and social contexts of rural areas.
Outcomes:
From the launch of DDU-GKY until the fiscal year 2021-22, the scheme has made considerable progress:
- Candidates Trained: A total of 6.78 lakh candidates received training under the DDU-GKY initiative. This large number indicates substantial engagement and outreach in rural communities to enhance skill development.
- Successful Placements: Of those trained, approximately 4.22 lakh candidates secured placements, demonstrating the effectiveness of the program in transitioning individuals from training to employment.
- Impact on Poverty Alleviation: By providing relevant skills and facilitating job placements, DDU-GKY has contributed to poverty alleviation efforts in rural areas, equipping individuals with the necessary tools to improve their economic circumstances.
6. Rural Self Employment Training Institutes (RSETIs)
Objective:
The Rural Self Employment Training Institutes (RSETIs) aim to promote self-employment among aspiring entrepreneurs in rural areas by providing them with the necessary skill development training. The primary goal is to enable these individuals to access bank credit and successfully start and manage their own micro-enterprises.
Implementation:
- Focus on Self-Employment: RSETIs specifically target self-employment as a means of livelihood in rural areas. They equip trainees with skills relevant to various trades, ensuring that the training aligns with local economic opportunities.
- Collaboration with Banks: The institutes operate in collaboration with multiple banks and organizations, which allows them to facilitate not only training but also access to financing and credit for starting micro-enterprises. This support is crucial for individuals who may lack the resources to begin their businesses independently.
- Customized Training Programs: RSETIs offer a variety of programs tailored to local needs, addressing different aspects of entrepreneurship and business management to enhance the chances of success for trainees.
Outcomes:
As of March 31, 2022, RSETIs have achieved significant milestones:
- Candidates Trained: 35 lakh candidates have been trained since the program’s inception in April 2008, reflecting extensive outreach and engagement in rural skill development.
- Settlements: Out of those trained, 24.41 lakh candidates have successfully settled into self-employment or secured wage employment, demonstrating the effectiveness of RSETIs in promoting entrepreneurship and improving livelihoods in rural areas. The success of these candidates contributes to economic growth and job creation within their communities.
7. Mahatma Gandhi National Rural Employment Guarantee Act (MGNREGA)
Objective:
Launched in 2005, the Mahatma Gandhi National Rural Employment Guarantee Act (MGNREGA) is landmark legislation designed to enhance livelihood security in rural areas. The primary objective is to guarantee 100 days of wage employment in a financial year to every rural household whose adult members volunteer for unskilled manual work. This initiative seeks to provide a safety net for rural families during times of economic distress.
Implementation:
- Guaranteed Employment: The scheme mandates that the government must provide wage employment for up to 100 days per household within a financial year if they request it. This guarantee helps ensure that rural families have access to income and work opportunities.
- Government Funding: MGNREGA is fully funded by the government, which allocates resources to ensure that rural households receive the promised wage employment. The scheme is implemented via local governance structures such as Panchayati Raj institutions, enhancing grassroots participation and accountability.
- Types of Work: Employment under MGNREGA is primarily focused on unskilled manual work, including tasks such as road construction, irrigation projects, and infrastructure development. This not only provides immediate income but also contributes to rural development.
Outcomes:
During the fiscal year 2021-22, MGNREGA achieved significant employment generation:
- Person-Days Generated: The program generated 363.49 crore person-days of employment, indicating extensive engagement and utility of the scheme. This figure reflects the high demand for wage work in rural areas and the program’s role in providing a vital economic lifeline to households.
- Impact on Livelihood: MGNREGA has effectively helped mitigate rural poverty and distress, offering a reliable source of income for families. It has also improved infrastructure and enhanced community resilience.
8. Prime Minister’s Employment Generation Programme (PMEGP)
Objective:
The Prime Minister’s Employment Generation Programme (PMEGP) focuses on generating employment opportunities in India by promoting the establishment of new self-employment ventures and projects, particularly in the non-farm sector. The scheme supports individuals in starting micro-enterprises, helping to foster entrepreneurship and drive job creation.
Implementation:
- Launch Mechanism: PMEGP is implemented through a combination of financial support from the government and skill development training. It targets individuals and groups looking to start new business ventures.
- Financial Assistance: The program provides subsidies for projects initiated by self-employed individuals, enabling them to access loans from banks and financial institutions with government backing to reduce financial barriers.
- Target Groups: It especially supports marginalized groups, such as women, SC/ST candidates, and youth, thereby promoting inclusivity in entrepreneurship.
Outcomes:
- During the fiscal year 2021-22 (up to March 15, 2022), PMEGP generated 6.91 lakh jobs, positively impacting the livelihood of many by empowering them to start their own businesses and contribute to the economy.
9. Pradhan Mantri Mudra Yojana (PMMY)
Objective:
The Pradhan Mantri Mudra Yojana (PMMY) was launched on April 8, 2015, with the aim of providing financial support to the unfunded micro-enterprises segment. This initiative seeks to enhance financial inclusion by making credit accessible to small enterprises, which often struggle to secure funding from formal banking systems.
Implementation:
Loan Categories: PMMY classifies loans into three categories based on the size of the business:
- Shishu: Loans up to ₹50,000 for startups.
- Kishore: Loans between ₹50,000 and ₹5 lakh for established businesses.
- Tarun: Loans between ₹5 lakh and ₹10 lakh for more developed businesses.
Financial Institutions: The scheme encourages lending from public and private sector banks, micro-finance institutions, and non-banking financial companies (NBFCs) to ensure broad access to funds for businesses.
Outcomes:
- During the fiscal year 2021-22, 5.38 crore loans were sanctioned under PMMY, with a total disbursement amounting to ₹3,31,402 crore. This significant financial input into the micro-enterprises sector has played a crucial role in facilitating entrepreneurship and supporting small businesses across various industries.
10. PM Street Vendors Atma Nirbhar Nidhi (PM SVANidhi)
Objective:
The PM Street Vendors Atma Nirbhar Nidhi (PM SVANidhi) scheme is designed to provide street vendors with access to affordable working capital. Launched to assist vendors adversely affected by the COVID-19 pandemic, the initiative aims to support their economic recovery and promote financial inclusion.
Implementation:
- Loan Accessibility: The scheme provides vendors with working capital loans of up to ₹10,000 with a repayment period of one year, which can be extended if required.
- Interest Subsidy: Vendors are eligible for an interest subsidy to alleviate the burden of loan repayment.
- Application Process: The scheme allows for a streamlined application process to facilitate access to credit immediately.
Outcomes:
- As of March 31, 2022, a total of 33.73 lakh loan applications were sanctioned under the scheme, with loan amounts disbursed against 30.89 lakh applications. This support has empowered many street vendors to restart and sustain their businesses post-pandemic.
11. Employment Provident Fund Organization (EPFO)
Objective:
The Employment Provident Fund Organization (EPFO) is responsible for providing and regulating the provident fund and pension schemes for the organized sector in India. It plays a crucial role in facilitating social security and retirement benefits for the workforce.
Implementation:
- Net Payroll Data: EPFO collects and maintains data on net payrolls, which illustrates employment trends in the organized sector, helping policymakers assess the labor market dynamics.
- Subscriber Benefits: EPFO manages contributions to employees’ provident funds, ensuring workers receive benefits upon retirement or withdrawal.
Outcomes:
- During the fiscal year 2021-22, 122.35 lakh new subscribers were registered under EPFO, reflecting trends in employment growth and the effectiveness of various employment generation initiatives.
Legislation on Gig Work
Rajasthan has taken a pioneering step by becoming the first state in India to pass legislation specifically aimed at the welfare of gig workers. This legislation recognizes the unique challenges faced by individuals working through digital platforms like Ola, Uber, Swiggy, Zomato, and Amazon, who were primarily categorized as “partners” rather than employees, thus lacking essential protections and benefits.
Key Features of the Legislation
1. Registration of Gig Workers:
- The bill mandates the registration of all gig workers with the state government, which will ensure that they are included within the framework of labor regulations.
- A comprehensive database of gig workers operating in Rajasthan will be maintained by the state government, aiding in effective governance.
- Each gig worker will be assigned a unique ID, which will facilitate tracking of their employment history and entitlements, improving transparency and accountability.
2. Access to Social Security Schemes:
- Gig workers will be granted access to a variety of social security schemes, which are crucial for their financial security.
- These schemes may cover health insurance, accident coverage, and other welfare measures to shield workers during emergencies, thereby providing a safety net similar to that enjoyed by traditional employees.
3. Grievance Redressal Mechanism:
- The legislation ensures that gig workers have the right to voice their grievances and have them addressed.
- A formal mechanism is established to protect the rights of gig workers, providing them with an official platform to resolve work-related disputes.
4. Establishment of Platform-Based Gig Workers Welfare Board:
- The legislation proposes the creation of a Welfare Board tasked with overseeing the welfare and rights of gig workers.
- This board will consist of state officials, five representatives each from gig workers and aggregators, and two additional members from civil society or related fields, with at least one-third of the nominated members being women.
- This inclusive representation aims to ensure balanced decision-making that considers the interests of both gig workers and employers.
5. Platform-Based Gig Workers Fund and Welfare Fee:
- A “Platform-Based Gig Workers Fund” has been introduced to finance social security measures for gig workers. This fund is crucial for supporting financial assistance and welfare benefits during challenging times.
- Aggregators will be levied a fee for each transaction involving a platform-based gig worker, with the specific percentage determined by the state government. This fee contributes to the welfare fund.
6. Penalties for Non-Compliance:
- The bill incorporates provisions for penalties in instances of non-compliance by aggregators.
- For failure to pay the welfare fee on time, aggregators will incur an interest rate of 12% per annum from the due date.
- Fines of up to ₹5 lakh may be imposed for the first violation, escalating to ₹50 lakh for subsequent contraventions, ensuring accountability among aggregators.
Challenges Remain
Despite these positive developments, the gig economy presents significant challenges:
- Low Wages: Many gig workers face underpayment, which compromises their financial stability.
- Unequal Gender Participation: Women often experience barriers that limit their participation and advancement in the gig economy, highlighting a need for focused efforts.
- Limited Avenues for Upward Mobility: Gig work often lacks pathways to career advancement, which can perpetuate economic inequality.
- Lack of Benefits: Gig workers traditionally have access to fewer benefits compared to regular employees, leading to growing demands for improved working conditions.
The Road Ahead
To ensure a more sustainable future for gig workers, several strategies are recommended:
- Fiscal Incentives: The NITI Aayog suggests providing financial incentives for businesses that prioritize female participation in the gig economy, encouraging gender equity.
- Enhanced Benefits: Implementing guarantees for retirement benefits, income support during periods of low demand, and paid sick leave would contribute to the overall security and welfare of gig workers.
- Balancing Opportunity and Protection: As India continues to embrace the gig economy, it is crucial to strike a balance between providing opportunities for flexibility and ensuring protections against exploitation.
Social Security and Its Connection to Poverty
The concept of social security is deeply interconnected with poverty, particularly concerning those classified as Below Poverty Line (BPL) and marginalized individuals who are often excluded from mainstream economic development. This demographic encompasses a variety of underprivileged groups, including:
- The Poor: Individuals and families struggling to meet basic survival needs, often living in extreme poverty.
- Backward Classes: Communities that face systemic disadvantages in education, employment, and social opportunities.
- Scheduled Castes and Scheduled Tribes: Historically marginalized groups that have been subject to discrimination and economic hardship.
Among these communities are landless individuals, small and marginal farmers, and workers in the informal sector who often face daily challenges in making ends meet. This vulnerable section of society experiences significant exploitation, struggles for recognition and support, and is frequently characterized as “silent sufferers” or “mere spectators” in an economy that is rapidly evolving and growing.
Government’s Strategy to Address Social Challenges
To effectively tackle the challenges faced by these disadvantaged groups, the government has adopted a comprehensive three-pronged strategy focusing on social security, development, and empowerment.
Broad Targeting
Broad targeting involves the implementation of comprehensive national programs designed to reach a significant number of beneficiaries and address various socio-economic issues. Key initiatives under this strategy include:
1. Pradhan Mantri Awas Yojana (PMAY)
Overview:
Launched in 2015, PMAY aims to provide affordable housing to the urban and rural poor, addressing the housing shortage faced by low-income families.
Key Features:
- Subsidies for Home Loans: The scheme offers interest subsidies on home loans, making it easier for economically weaker sections (EWS) and low-income groups (LIG) to afford homes.
- Construction of Houses: PMAY facilitates the construction of pucca (permanent) houses for eligible beneficiaries, ensuring basic amenities such as electricity, water, and sanitation.
- Urban and Rural Components: The program operates in both urban and rural areas, with specific provisions for the urban housing scheme (PMAY-U) and rural housing scheme (PMAY-R).
Impact:
By focusing on housing as a fundamental right, PMAY aims to enhance living standards, provide security, and promote social inclusivity, thereby contributing to overall poverty alleviation.
2. Mid-Day Meal Scheme
Overview:
This scheme was launched in 1995 to enhance the nutritional status of school-age children and promote school enrollment, attendance, and retention.
Key Features:
- Nutritional Support: Children are provided with free, nutritious meals during school hours, which helps combat malnutrition and supports their physical and cognitive development.
- Increased Enrollment: The provision of meals encourages more families to send their children to school, thereby improving literacy rates and educational outcomes.
- Implementation: The scheme is implemented in government and government-aided schools across India, covering elementary education.
Impact:
The Mid-Day Meal Scheme has significantly contributed to improving the nutritional status of children and has been instrumental in increasing school enrollment rates, thereby fostering educational growth.
3. Mahatma Gandhi National Rural Employment Guarantee Scheme (MGNREGA)
Overview:
Enacted in 2005, MGNREGA is a revolutionary employment guarantee scheme that offers 100 days of unskilled wage employment to one adult member of every rural household during the lean agricultural season.
Key Features:
- Guaranteed Employment: The scheme provides legal guarantees for wage employment, helping to secure livelihoods for rural families.
- Focus on Asset Creation: Employment generated under this scheme often involves work on public projects that contribute to rural infrastructure, such as building roads, irrigation projects, and water conservation efforts.
- Inclusivity: MGNREGA particularly emphasizes the involvement of marginalized groups, including women and scheduled castes/tribes, and ensures their participation in the workforce.
Impact:
MGNREGA has garnered global attention for its transformative approach to rural employment and poverty alleviation, providing a crucial safety net for rural households and enhancing community assets.
4. Swachh Bharat Abhiyan
Overview:
Launched in 2014, Swachh Bharat Abhiyan is a nationwide campaign aimed at improving sanitation and hygiene across urban and rural India.
Key Features:
- Focus on Toilet Construction: A major objective is to eradicate open defecation by constructing toilets in households, schools, and public places, particularly in rural areas.
- Behavior Change Campaign: The initiative includes public awareness campaigns to promote hygienic practices and encourage community participation in maintaining cleanliness.
- Solid Waste Management: The program also emphasizes proper waste disposal and management to ensure a cleaner environment.
Impact:
Swachh Bharat Abhiyan has made significant strides in improving sanitation and public health in India, with millions of toilets built and increased public awareness about hygiene.
5. Atal Mission for Rejuvenation and Urban Transformation (AMRUT)
Overview:
Launched in 2015, AMRUT focuses on urban development and infrastructure enhancement in cities and towns.
Key Features:
- Basic Services: The mission aims to provide basic services such as water supply, sewerage, drainage, and urban transport to improve the quality of life in urban areas.
- Investment in Infrastructure: AMRUT encourages investment in urban infrastructure development, including parks and open spaces, to enhance the urban environment.
- Capacity Building: The initiative also involves training municipal staff and strengthening urban governance to ensure effective implementation of urban development projects.
Impact:
AMRUT aims to transform urban areas by ensuring the availability of essential services, thereby contributing to sustainable urban growth and improved living conditions.
6. Integrated Child Development Services (ICDS)
Overview:
The Integrated Child Development Services (ICDS) program was launched in 1975 to address the critical issues of malnutrition and health among children and mothers. It aims to improve the overall nutritional and developmental outcomes for children aged under six years and pregnant and lactating mothers.
Key Features:
Comprehensive Services: ICDS encompasses a range of services that include:
- Supplementary Nutrition: Provides nutritious meals and snacks to children and mothers to combat malnutrition.
- Health Check-ups: Routine health assessments for early detection and intervention in health-related issues.
- Immunization: Ensures that children receive necessary vaccinations to protect against various diseases.
- Pre-school Education: Offers early childhood education to prepare children for formal schooling, fostering cognitive and social development.
- Health and Nutrition Education: Provides information to mothers and caregivers about nutrition, hygiene, and health practices to promote better health outcomes.
- Community-Based Approach: The program operates through a network of Anganwadi centers, which serve as the focal point for delivering services at the grassroots level. These centers work closely with local communities to reach underserved populations.
Impact:
The ICDS program has significantly improved the nutritional status of children and mothers across India. It has contributed to reducing child malnutrition rates, enhancing early childhood education, and promoting better health and nutrition awareness. By addressing multiple dimensions of child development and maternal health, ICDS plays a crucial role in shaping healthier future generations.
7. National Rural Health Mission (NRHM)
Overview:
The National Rural Health Mission (NRHM) was launched in 2005 as part of the National Health Mission (NHM) with the aim of improving healthcare delivery in rural areas. It specifically targets underserved populations, ensuring that they have access to essential health services and improving health outcomes.
Key Features:
- Strengthening Healthcare Infrastructure: NRHM works to enhance healthcare infrastructure in rural areas by upgrading existing facilities, establishing new health centers, and ensuring that necessary medical supplies and equipment are available.
- Community Participation: The mission emphasizes community involvement in healthcare planning and implementation. It encourages the establishment of health committees at the village level to ensure that local health needs are adequately addressed.
- Essential Health Services: NRHM focuses on providing a comprehensive range of health services, including maternal and child health, family planning, immunization, communicable and non-communicable disease prevention and control, and nutritional care.
- Capacity Building: The mission aims to strengthen the healthcare workforce by training and enhancing the skills of health workers, including Accredited Social Health Activists (ASHAs) and Auxiliary Nurse Midwives (ANMs), to improve service delivery.
Impact:
The implementation of NRHM has led to notable improvements in healthcare access and health indicators in rural areas. It has positively influenced maternal and child health outcomes, increased immunization rates, and provided critical healthcare services to populations that previously lacked access. Moreover, the focus on community participation has empowered local communities to take charge of their health, ensuring sustainability and relevance in health service delivery.
Narrow Targeting
Narrow targeting strategies are focused approaches aimed at addressing specific needs of particular demographics within the broader context of poverty alleviation and employment generation. These initiatives are designed to provide targeted support to individuals or groups who are in urgent need of assistance, primarily focusing on wage employment, self-employment, and food security. Here are key narrow targeting initiatives employed by the government:
1. Wage Employment Scheme (Mahatma Gandhi NREGA)
Overview:
The Mahatma Gandhi National Rural Employment Guarantee Act (MNREGA) is a flagship wage employment scheme aimed at providing guaranteed employment to rural households.
Key Features:
- Guaranteed Employment: The scheme mandates 100 days of wage employment in a financial year for every rural household whose adult members volunteer for unskilled manual work. This ensures a safety net for rural families during lean agricultural seasons.
- Focus on Livelihood Security: By providing guaranteed employment, MGNREGA aims to enhance livelihood security, reduce rural poverty, and improve infrastructure through labor-intensive public works.
- Empowerment of Marginalized Groups: MGNREGA emphasizes inclusivity by promoting the participation of women, Scheduled Castes (SC), and Scheduled Tribes (ST), contributing to social equity.
Impact:
MGNREGA has shown significant success in providing immediate financial support to rural households, contributing to improved living standards and community infrastructure.
2. Self-Employment Schemes
Self-employment schemes aim to empower individuals by providing them with the necessary skills and financial assistance to start their own businesses. Two major initiatives under this category are:
Deendayal Antyodaya Yojana – National Rural Livelihoods Mission (DAY-NRLM):
- Objective: Launched to reduce poverty by promoting self-employment and organizing rural poor into Self-Help Groups (SHGs).
- Implementation: The scheme offers skill training, financial support, and market linkages to help individuals establish sustainable livelihoods. It focuses on women’s empowerment by encouraging their participation in SHGs.
- Outcomes: DAY-NRLM has facilitated numerous rural households in gaining access to income-generating activities, thereby improving their economic status.
Deendayal Antyodaya Yojana – National Urban Livelihoods Mission (DAY-NULM):
- Objective: This scheme targets urban areas to provide self-employment opportunities for the urban poor.
- Implementation: DAY-NULM supports skill development and entrepreneurship among urban youth, providing capacity building and financial assistance to set up self-employment ventures.
- Outcomes: It has helped many urban dwellers to secure a sustainable means of livelihood, reducing dependency on informal employment.
3. Food Security Initiatives
Food security programs aim to ensure that vulnerable populations have access to sufficient and nutritious food, which is a critical component of poverty alleviation. Key initiatives include:
National Food Security Act (NFSA) 2013:
- Overview: This legislation aims to provide subsidized food grains to the eligible population.
- Key Features: It guarantees the right to food for approximately two-thirds of India’s population, ensuring access to essential food items at a subsidized rate.
- Impact: NFSA strengthens food security by providing a safety net for vulnerable households, reducing hunger and malnutrition.
Antodaya Anna Yojana:
- Overview: This scheme is aimed at providing food security to the poorest of the poor by supplying them with food grains at highly subsidized rates.
- Implementation: Beneficiaries are identified and provided with a Monthly Food Grain Allowance to meet their nutritional needs.
- Impact: It has significantly improved the food security status of the poorest households, alleviating hunger and supporting better health outcomes.
Pradhan Mantri Garib Kalyan Ann Yojana:
- Overview: Introduced in response to the COVID-19 pandemic, this temporary scheme ensured additional food grain support to the most vulnerable sections.
- Key Features: It provided free food grains to all ration cardholders, supplementing existing provisions under the NFSA.
- Impact: The initiative ensured that low-income households received essential food security support during the crisis, thereby protecting them from food insecurity.
Social Security Programs in India
Social security is a crucial aspect of ensuring the well-being and protection of citizens, especially those from marginalized and vulnerable backgrounds. The Government of India has implemented various programs aimed at providing social security, health care, financial support, and nutrition to its people. Below is a detailed explanation of key social security initiatives:
1. Ayushman Bharat – Pradhan Mantri Jan Arogya Yojana (AB-PMJAY)
Overview:
Launched in 2018, the Ayushman Bharat – Pradhan Mantri Jan Arogya Yojana (AB-PMJAY) is a flagship health insurance scheme of the Government of India designed to provide healthcare coverage to economically disadvantaged populations. The initiative aims to ensure that all families have access to essential health services without facing financial hardships due to medical expenditures.
Key Features:
- Health Insurance Coverage: The scheme provides health insurance coverage of up to ₹5 lakh per family per year for secondary and tertiary care hospitalization expenses. This coverage includes a wide range of medical treatments, procedures, and surgeries that can be costly, thus alleviating financial strain on families during health emergencies.
- Targeted Beneficiaries: AB-PMJAY targets families identified as vulnerable through the Socio-Economic Caste Census (SECC) 2011. Approximately 10.74 crore families are eligible for benefits under the scheme, which includes marginalized and low-income groups across various states. This targeted approach ensures that resources are directed toward those who need them most.
- Cashless Treatment: The scheme facilitates cashless treatment for beneficiaries at empaneled hospitals. This means that eligible individuals do not have to pay for medical services upfront; instead, hospitals claim the expenses directly from the government, simplifying the process for patients.
- Wide Network of Empaneled Hospitals: AB-PMJAY provides access to a vast network of public and private hospitals across the country, allowing beneficiaries to receive treatment at facilities that best suit their needs.
- No Cap on Family Size: Unlike some insurance schemes, AB-PMJAY does not impose a cap on family size or the number of members covered per household, making it more inclusive.
Impact:
- Enhanced Access to Healthcare: AB-PMJAY has significantly improved access to necessary health services for the economically disadvantaged, ensuring that families can avail themselves of treatments they might have previously avoided due to cost concerns.
- Reduction in Out-of-Pocket Expenditure: By providing comprehensive health coverage, the scheme reduces out-of-pocket expenses for households, which has traditionally been a barrier to seeking medical care. This financial protection is crucial for low-income families, as medical emergencies can lead to severe financial crises.
- Strengthened Healthcare Delivery: The implementation of AB-PMJAY has also stimulated the healthcare sector, encouraging the establishment of more health facilities, particularly in rural and underserved areas, to meet the growing demand for services covered under the scheme.
- Economic Stability: With improved access to healthcare and reduced financial burden, families can manage health emergencies more effectively, contributing to greater economic stability and improved overall well-being within communities.
2. Pradhan Mantri Shram Yogi Maan-dhan Yojana (PMSYM)
Overview:
The Pradhan Mantri Shram Yogi Maan-dhan Yojana (PMSYM) was launched in 2019 as a social security initiative aimed specifically at providing pension benefits to workers in the unorganized sector. This scheme recognizes the critical role that unorganized sector workers play in the economy and seeks to provide them with financial security in their old age.
Key Features:
Eligibility:
- The scheme is open to any unorganized sector worker aged between 18 and 40 years. This age range ensures that young workers can start their contribution early in their careers, thus increasing the pension benefits they can accrue over time.
- Applicants are required to provide basic identity and income-related information to facilitate their enrollment.
Monthly Contributions:
- Participants must make monthly contributions that vary based on their age at the time of enrollment. The contribution structure is designed to be affordable, encouraging participation among low-income workers.
Pension Amount:
- Upon reaching the age of 60 years, beneficiaries of PMSYM are entitled to receive a monthly pension of ₹3,000. This amount provides a substantial safety net for retired workers, helping them maintain their livelihood and quality of life after exiting the workforce.
Portability:
- The scheme is designed to be portable, which means that workers can maintain their membership and continue making contributions regardless of job changes or geographical mobility within the unorganized sector.
Government Contribution:
- The government also plays a crucial role by bearing a portion of the costs associated with providing the pension, ensuring the sustainability and viability of the program.
Impact:
- Financial Security for Unorganized Workers: PMSYM significantly enhances the financial security of workers in the unorganized sector, many of whom do not have access to formal retirement benefits. By providing a guaranteed income during retirement, the scheme alleviates poverty among elderly individuals who have spent their lives working in informal jobs.
- Encouragement of Savings:
- The requirement for monthly contributions encourages a culture of saving and financial planning among workers, promoting greater financial literacy and responsibility over time.
- Support for Vulnerable Populations:
- PMSYM is particularly beneficial for marginalized individuals, including women and low-income workers, who may have limited access to other forms of retirement planning or pension systems.
- Reduction in Dependence on Family Support:
- By providing a stable income post-retirement, the scheme reduces dependence on family members for financial support, contributing to improved dignity and autonomy for older adults.
3. POSHAN Abhiyan
Overview:
Launched in March 2018, POSHAN Abhiyan (National Nutrition Mission) is a comprehensive scheme initiated by the Government of India aimed at improving the nutritional outcomes for children and women across the nation. The program embodies a multi-faceted approach to tackle the serious issues of malnutrition that affect large segments of the population, particularly in vulnerable communities.
Key Features:
Focus Area:
- The initiative specifically targets critical areas such as:
- Reducing Stunting: Aiming to lower the prevalence of stunting among children under the age of six, which is a major issue affecting their growth and cognitive development.
- Addressing Undernutrition: POSHAN Abhiyan seeks to combat undernutrition, ensuring that children receive adequate nutrition for healthy development.
- Combatting Anemia: The program focuses on reducing anemia among women of reproductive age, which is essential for maternal health and the health of newborns.
- The initiative specifically targets critical areas such as:
Multi-Sectoral Approach:
- POSHAN Abhiyan employs a multi-sectoral strategy, engaging various ministries and departments, including health, education, and women’s welfare, to create a holistic approach to nutrition.
- The initiative leverages community-based strategies and partnerships with local organizations, NGOs, and other stakeholders to implement localized solutions that are tailored to meet specific nutritional needs.
Technology and Innovation:
- The program emphasizes the use of technology, including mobile applications and management Information systems, to track nutritional outcomes, monitor growth, and ensure transparency in implementation. Anganwadi workers are equipped with mobile tools to facilitate real-time reporting and data collection.
Awareness Campaigns:
- POSHAN Abhiyan also focuses on raising awareness about the importance of nutrition and health through community outreach and educational programs, aiming to change dietary habits and promote healthy practices.
Impact:
- Addressing Malnutrition: POSHAN Abhiyan plays a crucial role in addressing malnutrition in India, which continues to be a significant public health concern. By focusing on children and women, the initiative targets two of the most vulnerable groups directly linked to public health and development.
- Improving Health Indicators: The scheme is instrumental in improving health indicators such as stunting rates, anemia prevalence, and overall child nutrition, contributing to enhanced health and developmental outcomes. Improved nutrition serves as a foundation for better learning capabilities in children, higher productivity in adults, and healthier families.
- Contributing to Childhood Growth and Development: By promoting better nutritional practices and providing access to essential resources, POSHAN Abhiyan supports natural growth and development in children, setting the stage for a healthier and more productive adult population.
4. Pradhan Mantri Jeevan Jyoti Bima Yojana (PMJJBY)
Overview:
Launched in 2015, the Pradhan Mantri Jeevan Jyoti Bima Yojana (PMJJBY) is a government-backed life insurance scheme aimed at providing affordable life coverage to individuals, particularly targeting the low-income population of India. The scheme is part of the larger initiative to enhance financial inclusion and security among the citizens.
Key Features:
- Coverage Amount: The PMJJBY offers a sum assured of ₹2 lakh in the event of the policyholder’s death due to any cause (including natural and accidental causes). This coverage ensures that families have financial support when they need it the most.
- Affordability: One of the standout features of PMJJBY is its low premium rate of ₹330 annually, which makes it highly accessible for the poorer segments of society. This low cost encourages enrollment among individuals who may otherwise be unable to afford life insurance.
- Eligibility Criteria: The scheme is available to all individuals aged between 18 and 50 years. They must have a savings bank account and can enroll through their respective banks or financial institutions that offer this scheme.
- Enrollment Process: Enrollment in PMJJBY is straightforward and typically requires minimal documentation, making it convenient for individuals to acquire life insurance coverage.
- Renewal and Claims: The policy can be renewed annually, and it automatically lapses if the premium is not paid on time. The claim process is designed to be efficient, ensuring that beneficiaries receive their assured amount promptly.
Impact:
- Financial Security for Families: PMJJBY plays a crucial role in ensuring financial security for families in the event of the untimely death of the breadwinner. By providing a safety net, it reduces the financial burden on families, mitigating the risks associated with sudden loss of income.
- Encouragement of Life Insurance Penetration: The scheme has contributed to increasing the penetration of life insurance in India, especially among low-income groups who previously had limited or no access to financial protection products.
- Peace of Mind: For many beneficiaries, participating in PMJJBY offers peace of mind, knowing that their families will be financially supported in case of unexpected events. This reassurance fosters greater stability and confidence in pursing employment and economic opportunities.
- Contribution to Overall Financial Inclusion: PMJJBY is an integral part of India’s broader goal of promoting financial inclusion. By making affordable coverage available, it encourages individuals to think about insurance and savings, thereby fostering a culture of financial planning.
5. Pradhan Mantri Suraksha Bima Yojana (PMSBY)
Overview:
The Pradhan Mantri Suraksha Bima Yojana (PMSBY) was launched in 2015 as a government-backed accidental insurance scheme designed to provide financial protection to individuals against unforeseen accidents. The scheme aims to enhance the safety net for low-income populations by offering affordable insurance coverage.
Key Features:
Coverage Amount:
- Accidental Death: The scheme provides a compensation of ₹2 lakh in the event of the policyholder’s accidental death. This amount helps support the family financially when a breadwinner is lost unexpectedly.
- Total Disability: In cases of total disability due to an accident, the scheme offers a compensation amount of ₹1 lakh. This coverage assists individuals who can no longer work due to their disabilities, aiding in their recovery and rehabilitation.
Affordable Premium:
- The annual premium for PMSBY is set at just ₹12, making it one of the most affordable insurance options available. This low-cost premium encourages widespread enrollment, particularly among low-income individuals who might otherwise forgo insurance due to cost concerns.
Eligibility Criteria:
- Age Requirement: The scheme is available to individuals aged between 18 and 70 years, facilitating coverage for a wide demographic, including both working adults and older individuals.
Enrollment Process:
- Enrollment can be done through banks and financial institutions, and it typically requires minimal documentation, making it easy for individuals to obtain coverage.
Claim Process:
- The claim process is streamlined to ensure that beneficiaries can access their compensation quickly and efficiently in the case of an accident. This is crucial for supporting families during difficult times.
Impact:
- Enhanced Financial Safety Net: PMSBY significantly strengthens the financial safety net for families affected by accidents, helping to offset the economic impact of losing a primary earner or facing long-term disability. This is especially important for vulnerable populations who may lack other forms of insurance or financial support.
- Promotion of Risk Protection: By encouraging individuals to participate in a low-cost insurance scheme, PMSBY promotes a culture of risk protection. It fosters awareness about the need for safety nets against accidents and reinforces the importance of insurance coverage in personal financial planning.
- Empowerment of Low-Income Individuals: The affordability and accessibility of PMSBY particularly benefit low-income individuals who often do not have access to health insurance or other financial safeguards. This empowerment helps improve their resilience against unexpected financial shocks due to accidents.
- Reduction in Dependence on Family Support: By providing compensation in case of accidental death or disability, PMSBY allows families to minimize dependency on their immediate relatives for financial assistance, promoting greater independence and stability.
6. Pradhan Mantri Jan Dhan Yojana (PMJDY)
Overview:
Launched in 2014, the Pradhan Mantri Jan Dhan Yojana (PMJDY) is a significant financial inclusion initiative by the Government of India, designed to ensure that all citizens, particularly the underserved and low-income groups, have access to essential banking services. The scheme aims to promote savings, facilitate financial literacy, and integrate the unbanked into the financial system.
Key Features:
Bank Accounts:
- PMJDY facilitates the opening of zero-balance bank accounts, allowing individuals to maintain accounts without the burden of maintaining a minimum balance. This feature eliminates barriers for the economically disadvantaged who may be reluctant to open accounts due to financial constraints.
Direct Benefit Transfers (DBTs):
- The scheme enables direct transfer of subsidies and benefits from various government schemes directly into beneficiaries’ bank accounts. This process reduces corruption and leakage associated with the distribution of entitlements, ensuring that the aid reaches those who genuinely need it.
Overdraft Facility:
- Account holders are provided with an overdraft facility (up to ₹10,000) after a satisfactory operation of the account for six months, enabling easier access to funds in times of need.
Financial Literacy Program:
- The initiative includes financial literacy components to educate account holders about managing finances, budgeting, and the importance of saving, fostering better financial habits.
Insurance Benefits:
- Under PMJDY, account holders are eligible for life insurance coverage and accidental insurance schemes, providing additional financial security.
Impact:
- Increased Bank Account Ownership: PMJDY has significantly increased the number of bank accounts in India, particularly among low-income and marginalized groups. This inclusivity is vital for empowering individuals and integrating them into the formal economy.
- Enhanced Financial Literacy: By promoting awareness and financial education, PMJDY has improved financial literacy among the unbanked population, equipping them with essential knowledge for better financial management and decision-making.
- Effective Benefit Delivery: The direct transfer of government benefits has minimized the leakages and delays historically associated with subsidy disbursement. By linking benefits directly to bank accounts, the government has streamlined the process, ensuring timely and accurate delivery of assistance.
7. Prime Minister Street Vendor’s Atma Nirbhar Nidhi (PM SVANidhi)
Overview:
Launched in 2020, the Prime Minister Street Vendor’s Atma Nirbhar Nidhi (PM SVANidhi) scheme is designed to provide street vendors with access to affordable working capital. This initiative was particularly important in helping vendors recover economically after the disruptions caused by the COVID-19 pandemic.
Key Features:
Loan Scheme:
- PM SVANidhi offers working capital loans of up to ₹10,000 to street vendors. These loans can assist vendors in meeting their daily operational expenses, purchasing stock, or expanding their business.
Interest Subsidy:
- The scheme provides an interest subsidy to ease the financial burden on vendors, incentivizing timely repayments and enhancing affordability.
Easy Application Process:
- The application process for PM SVANidhi is designed to be straightforward, ensuring that vendors can easily access funds without complex documentation.
Support for Economic Recovery:
- The scheme aims to promote economic stability for street vendors who are a crucial component of the informal economy, helping them regain and sustain their livelihoods post-pandemic.
Impact:
- Financial Assistance: PM SVANidhi has been instrumental in providing immediate financial relief to street vendors during a critical recovery period, allowing them to restart their businesses and generate income.
- Increased Economic Resilience: By integrating street vendors into a formal credit framework, the scheme fosters economic resilience, reducing vulnerability to future economic shocks.
- Support for Informal Sector: The initiative recognizes the importance of street vendors in urban economies and promotes their welfare, thereby enhancing their contributions to local economies.
8. Atal Pension Yojana (APY)
Overview:
The Atal Pension Yojana (APY) was launched in 2015 with the objective of providing a pension scheme specifically tailored for workers in the unorganized sector and promoting financial security in old age. This initiative aims to enhance the social security net for individuals who do not have access to any formal pension scheme.
Key Features:
Eligibility:
- APY is available to all Indian citizens aged between 18 and 40 years. Individuals must have a savings bank account to enroll in the scheme.
Pension Amount:
- Upon reaching the age of 60, beneficiaries are entitled to receive a guaranteed monthly pension ranging from ₹1,000 to ₹5,000, depending on their contributions. The amount is determined based on the age at which the individual joins the scheme and the pension amount they desire at retirement.
Contribution Structure:
- Beneficiaries need to make regular contributions to the pension fund, which varies based on the selected pension amount. Typically, the younger the individual enrolls, the lower the monthly contribution needed to achieve the desired pension.
Government Co-Contribution:
- In the initial years of implementation, the government offered co-contributions for eligible subscribers. Specifically, the government would contribute 50% of the total contribution or ₹1,000 per annum (whichever is lower) for a period of five years for those who joined the scheme before 2016 and were not part of any social security scheme previously.
Withdrawal and Benefits:
- The contributions made towards the APY are accumulated in the National Pension System (NPS). On the death of the subscriber before the age of 60, the spouse can continue the scheme or the nominee can receive the corpus amount. In the event of the subscriber’s death after the age of 60, the pension will be paid to the spouse.
Impact:
- Financial Security in Old Age: APY aims to ensure that individuals from the unorganized sector have a financial safety net during retirement, thus reducing the risk of poverty in old age.
- Encouragement of Savings: The scheme promotes a culture of saving for retirement among individuals who might otherwise overlook long-term financial planning. Contributions to APY help participants to build a steady income stream for their later years.
- Broadening Coverage: By focusing on unorganized sector workers—many of whom lack access to traditional pension schemes—APY helps broaden social security coverage in India and encourages greater participation in formal financial systems.